Complete Guide to Dissolved Oxygen Monitoring in Aquaculture
From hypoxia prevention to automated aeration control – optical vs electrochemical sensors, ROI case studies, and best practices for fish & shrimp farms.
Dissolved Oxygen Monitoring in Aquaculture
Effective dissolved oxygen monitoring in aquaculture is the heartbeat of any intensive operation. The concentration of oxygen dissolved in your pond water dictates whether stock thrives, grows efficiently, or succumbs to catastrophic mass mortality within hours. As global aquaculture expands to meet protein demands while wild fisheries decline, precise, real-time monitoring and intelligent aeration control have become fundamental business requirements.
This guide is built on a scientific framework that organizes the challenge of dissolved oxygen monitoring in aquaculture into three interconnected pillars: causal factors, predictive & monitoring technologies, and intelligent control integration. It draws on peer-reviewed research from Aquacultural Engineering, on-the-ground industry reporting, and deep technical solution insights to give you a trusted playbook for turning oxygen management into a measurable competitive advantage.
Why Dissolved Oxygen Monitoring is the #1 Critical Parameter in Aquaculture
The science of DO and aquatic respiration
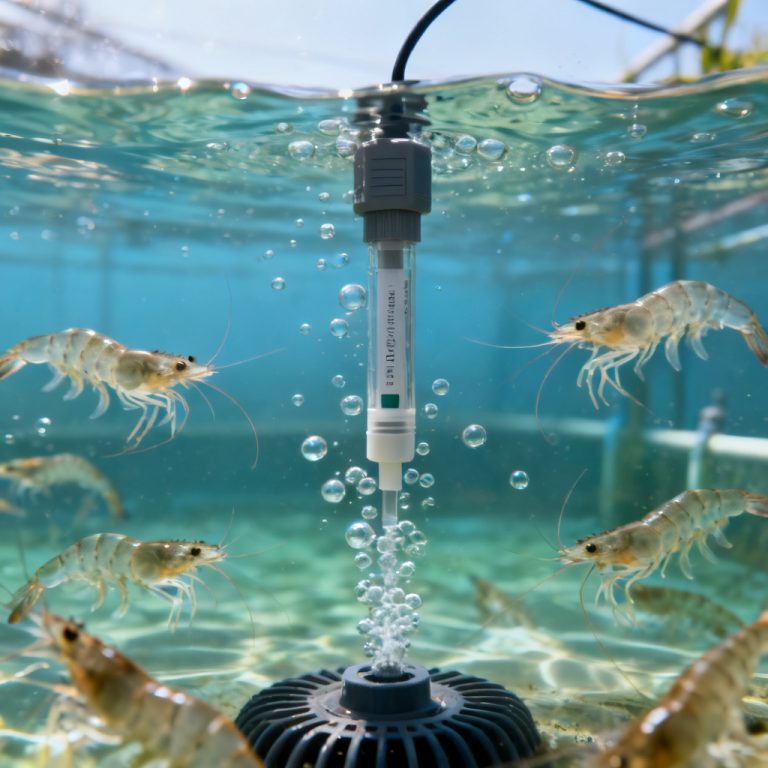
Every aquaculture professional relying on dissolved oxygen monitoring understands that all aerobic aquatic organisms—shrimp, tilapia, or salmon—must extract oxygen from water that holds only a fraction of the oxygen in air. Solubility is governed by temperature, salinity, and pressure; as water temperature rises, solubility decreases while metabolic respiration increases. This creates a dangerous convergence that dissolved oxygen monitoring is designed to track in real time.
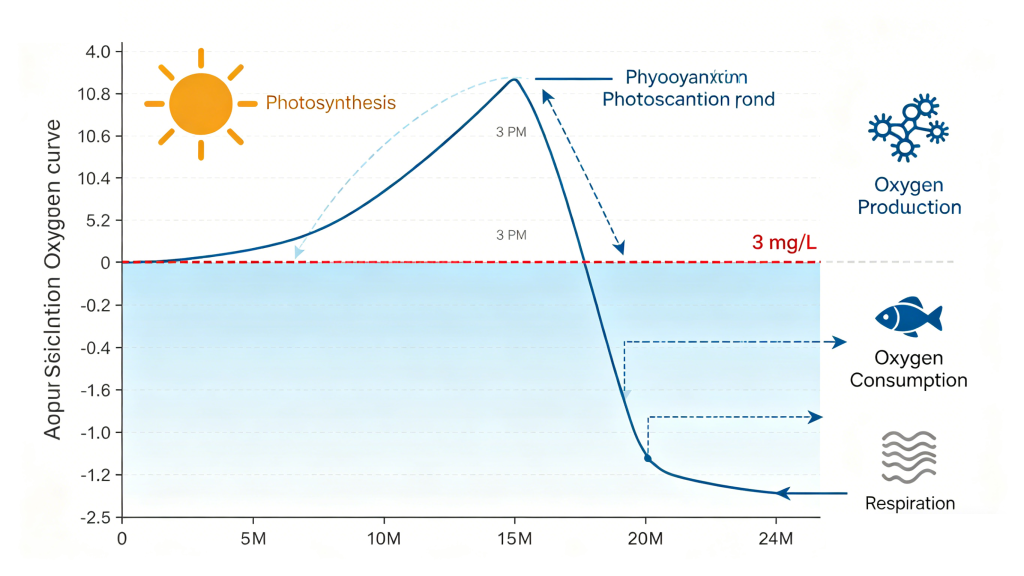
A comprehensive review in Aquacultural Engineering classifies the processes that directly control pond DO levels into five main categories: atmospheric aeration, photosynthesis by phytoplankton, respiration of all biomass, decomposition of organic matter, and nitrification by bacteria. Each fluctuates diurnally, causing DO to swing from afternoon supersaturation to pre-dawn critical lows—exactly the dynamic that continuous dissolved oxygen monitoring captures.
Oxygen consumption rates by species (shrimp vs. tilapia vs. salmon)
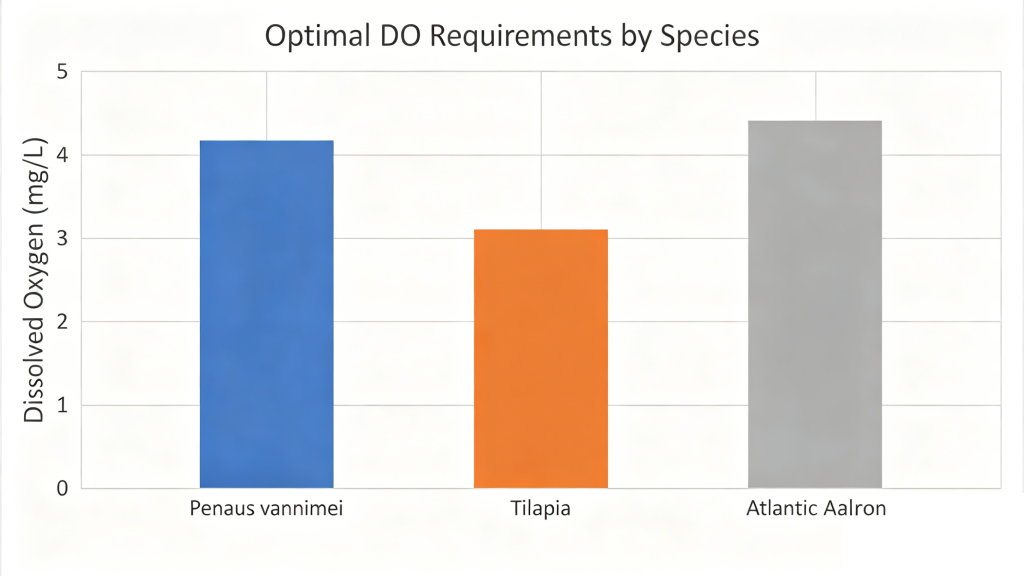
Designing a dissolved oxygen monitoring strategy starts with species-specific oxygen demands.
- Penaeid shrimp: Highly sensitive benthic organisms demanding stable DO above 5 mg/L for optimal feed intake; mortality can begin below 3 mg/L.
- Tilapia: Tolerant of moderate drops, but chronic DO below 4 mg/L depresses immune response and feed utilization.
- Salmonids: Cold-water, high-oxygen-demanding fish requiring DO above 6 mg/L in intensive systems; even short-term dips suppress growth performance.
Economic impact of suboptimal DO
Precision dissolved oxygen monitoring in aquaculture translates directly into profitability by preventing three economic thresholds.
- DO < 3 mg/L → acute mortality risk, the zone where hypoxia kills thousands of kilograms overnight—as tragically documented in Philippine fish kills or Chilean salmon losses.
- DO 4–5 mg/L → reduced feed conversion ratio (FCR). Suboptimal oxygen forces animals to expend energy on respiration, eroding margins over an entire grow-out cycle.
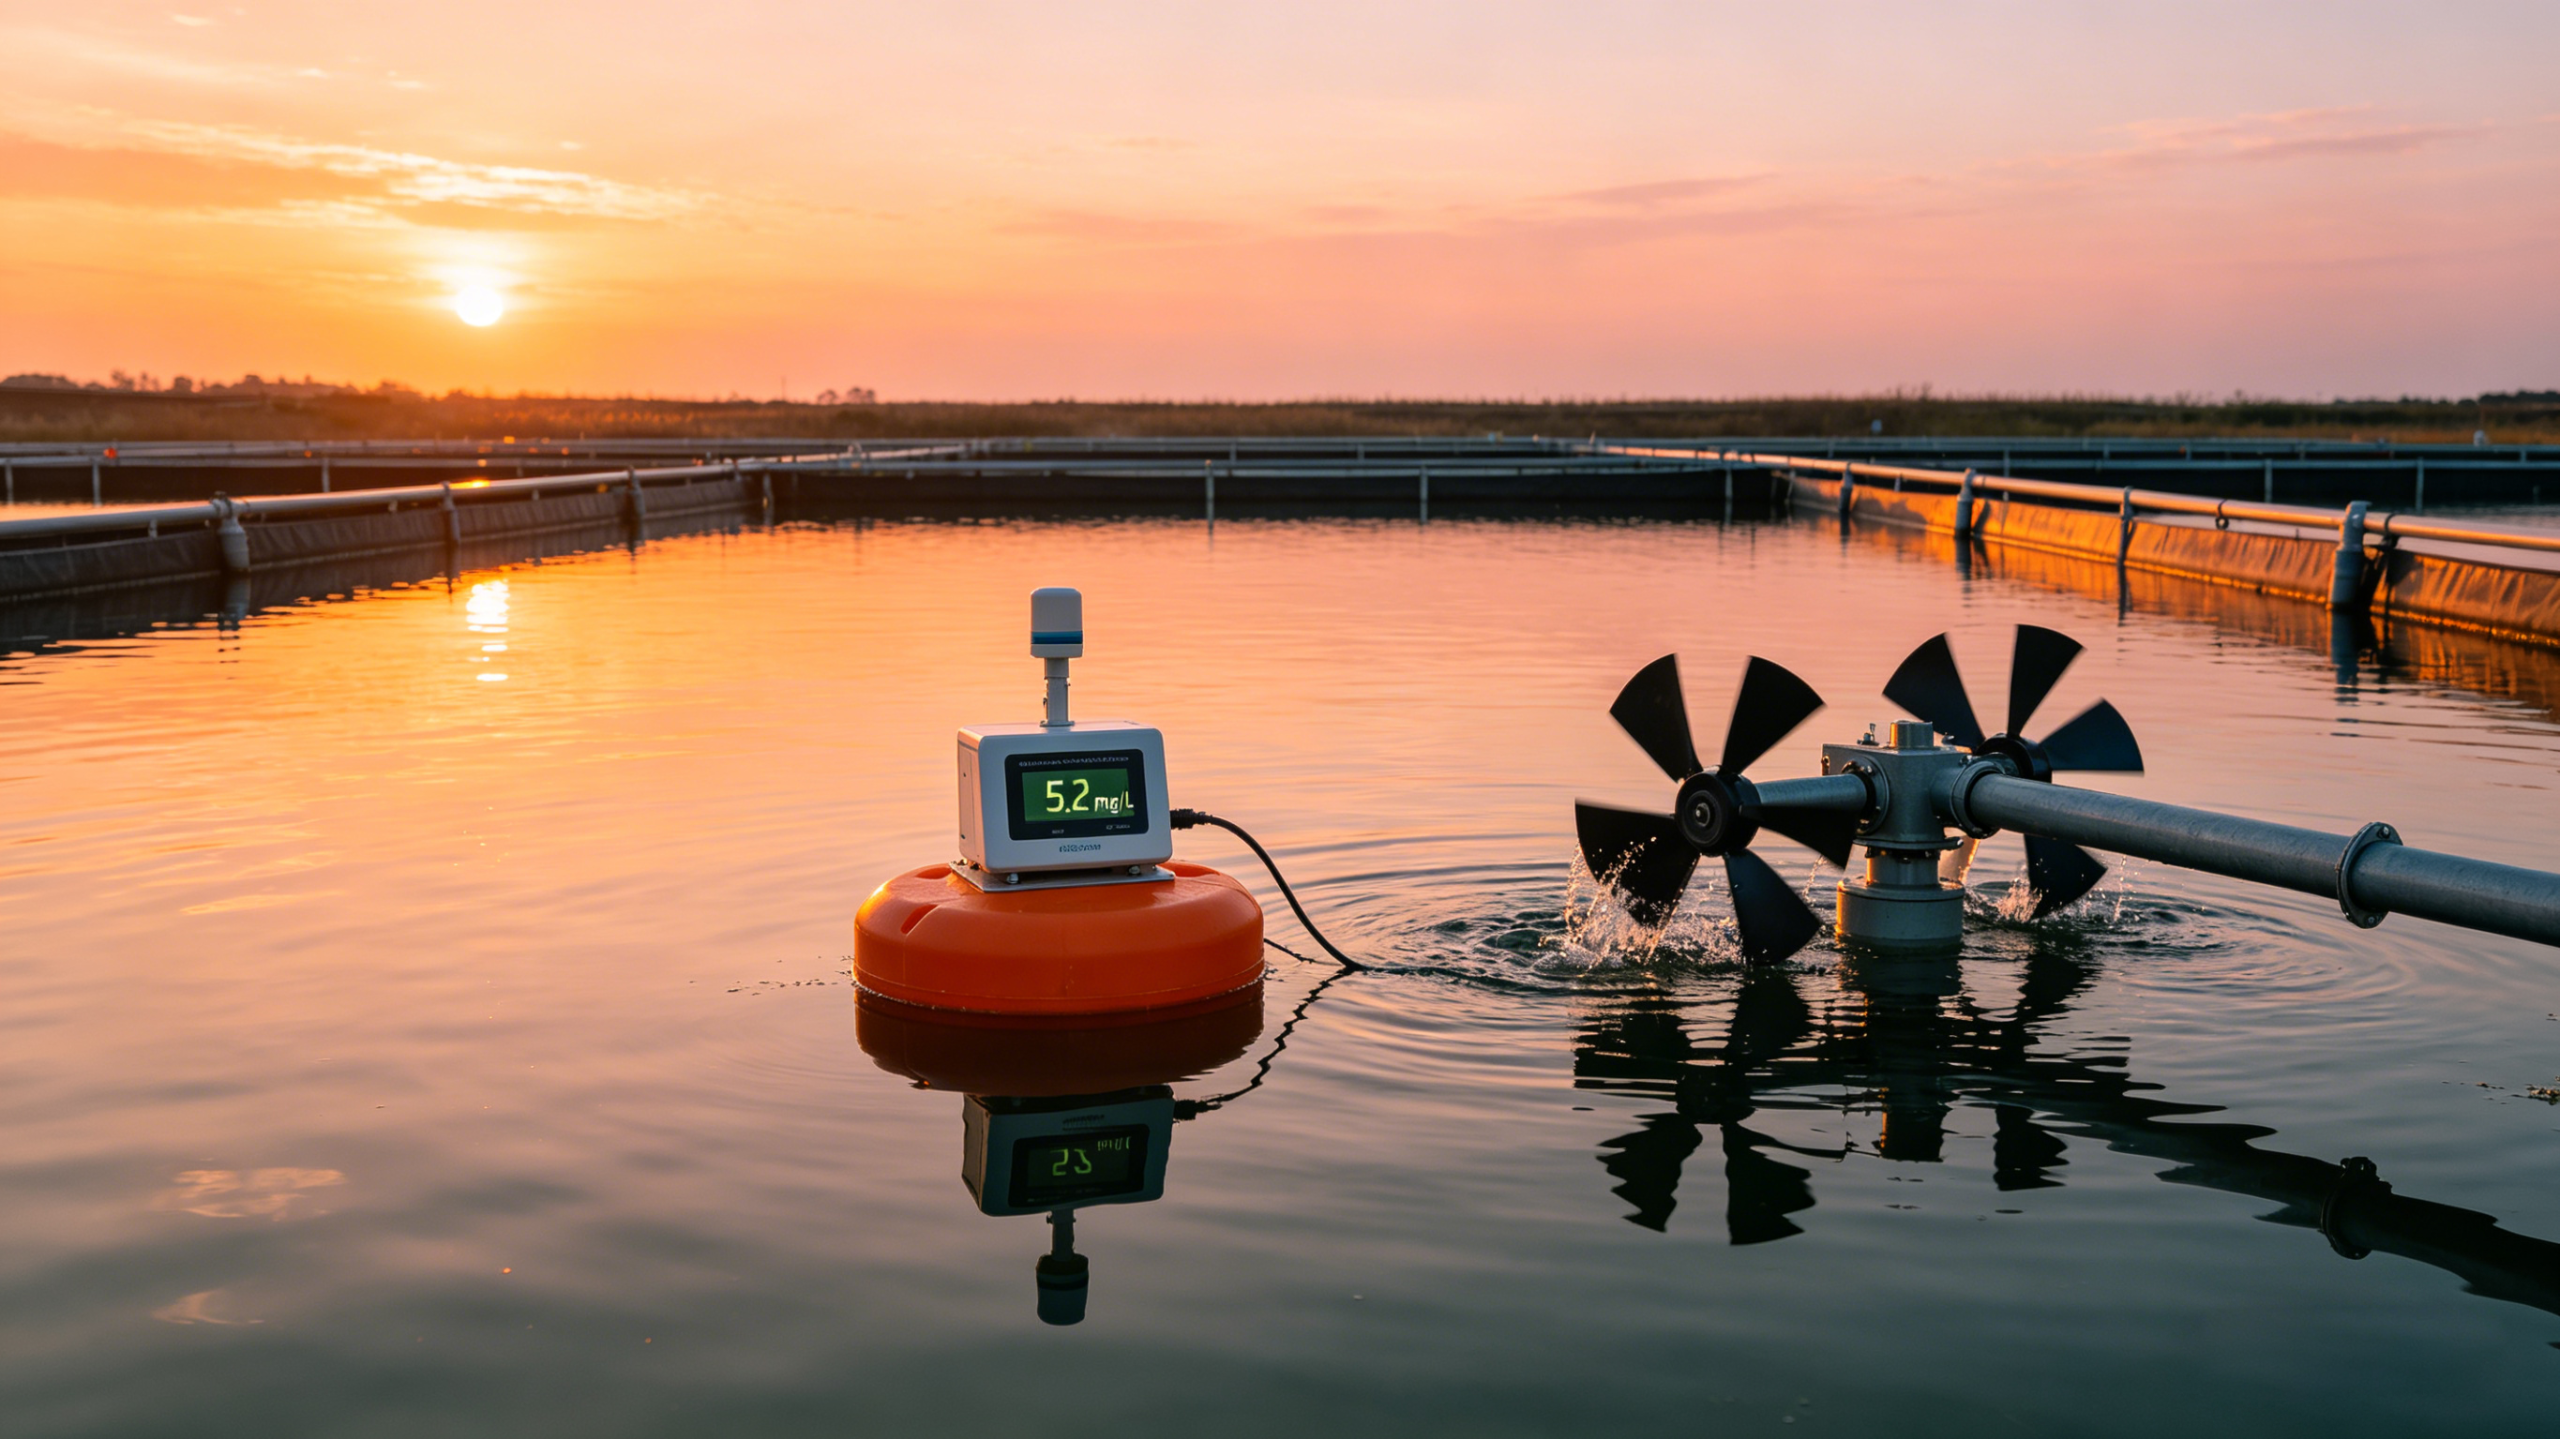
- DO > 5 mg/L → optimal growth, survival, and FCR. Maintaining oxygen near saturation realizes genetic growth potential while minimizing cost per kilogram produced.
Understanding Hypoxia Through Dissolved Oxygen Monitoring
Natural vs. induced hypoxia
Reliable dissolved oxygen monitoring reveals that hypoxia results from predictable physical, chemical, and biological drivers, not random events.
Seasonal stratification, algal blooms, overfeeding
Dissolved oxygen monitoring systems must account for the following hypoxia triggers.
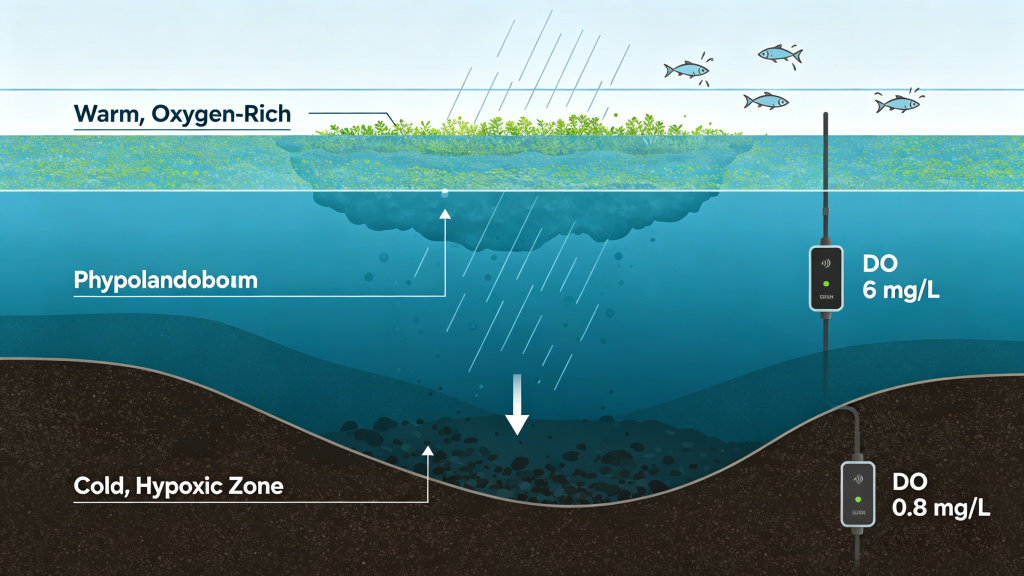
- Thermal stratification: In deeper ponds, solar heating creates a warm surface layer that does not mix with cooler bottom water. Dissolved oxygen in the isolated bottom layer is rapidly consumed by sediment respiration. A sudden cold rain can trigger a turnover, mixing this anoxic water throughout the pond and causing mass kills.
- Algal blooms: Dense phytoplankton generate high daytime DO but consume massive oxygen at night through respiration, causing pre-dawn lethal crashes.
- Overfeeding: Excess feed and accumulated feces drive sediment oxygen demand, ammonia spikes, and nitrification that further strip oxygen. This is one of the most common hypoxia triggers, fully preventable with better management.
Early warning indicators
With continuous dissolved oxygen monitoring, you can detect hypoxia in its earliest metabolic and behavioral phases, long before visual stress appears.
Behavioral changes (surface gathering, lethargy), nighttime DO dips
- Surface gathering and piping: When DO declines, many species migrate to the surface. Shrimp flock to pond edges; fish “pipe” at the air–water interface. Dissolved oxygen monitoring catches the oxygen drop before this behavior becomes widespread.
- Lethargy and reduced feeding: A drop from 5 mg/L to 3.5 mg/L dramatically reduces feed response, leading to uneaten pellets that accelerate water quality deterioration.
- Nighttime trend monitoring: The most reliable early warning is the slope of the nighttime DO decline, captured by a permanent monitoring station logging data every minute. This enables aeration to be triggered before the inflection point toward hypoxia.
DO Sensor Technologies for Aquaculture Monitoring
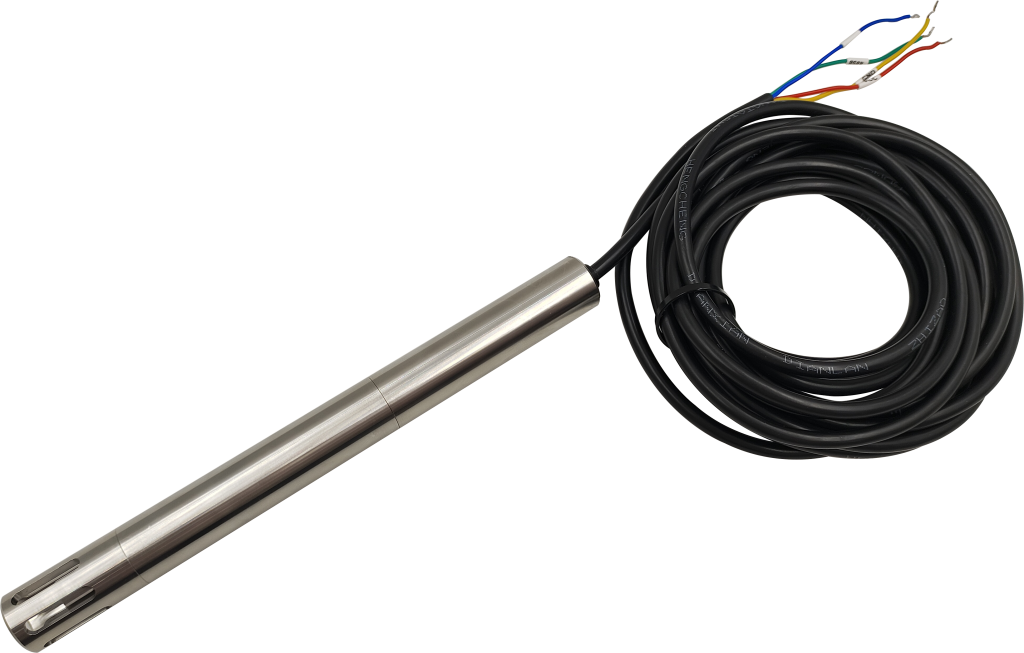
The foundation of any reliable dissolved oxygen monitoring in aquaculture is the sensor itself, which must deliver stable, accurate data under harsh conditions with minimal human intervention.
Optical (fluorescence) DO sensors
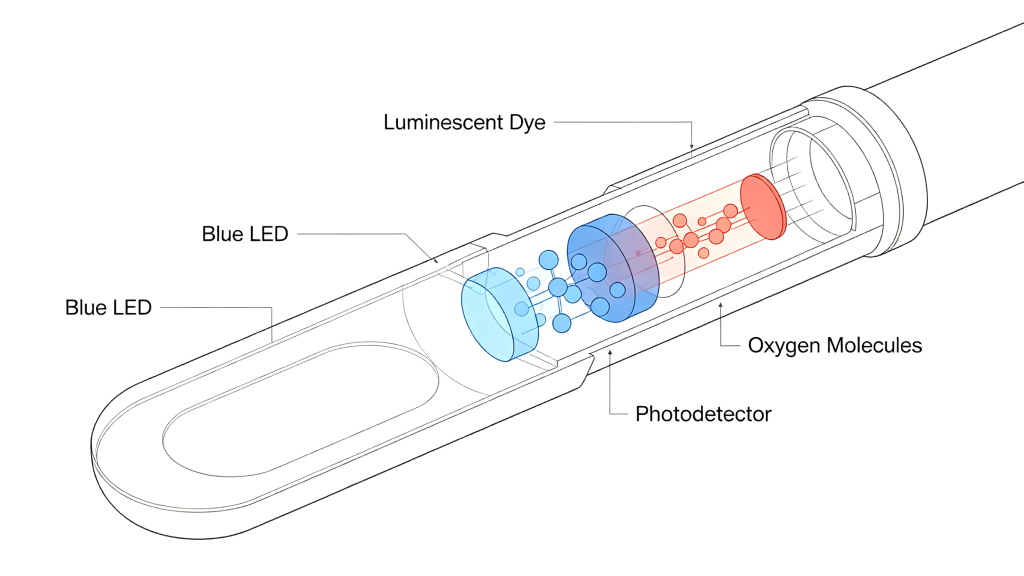
Optical sensors have become the standard for optical DO sensor technology in intensive aquaculture. They operate on dynamic luminescence quenching: a blue light excites a luminescent dye on a sensing cap; the lifetime of the emitted red light is inversely proportional to oxygen concentration.
Because the sensing element is a solid-state dye membrane rather than an electrochemical cell, optical fluorescence technology eliminates the most frustrating pain points. There is no membrane to replace, no electrolyte to foul, and no anode/cathode to degrade. This fundamental advantage makes optical sensors ideal for long-term, unattended dissolved oxygen monitoring in nutrient-rich aquaculture waters.
Galvanic vs. Polarographic sensors
Both galvanic and polarographic electrodes consume oxygen at a cathode behind a permeable membrane. Galvanic sensors self-generate voltage but consume their anode through oxidation. Polarographic sensors require external voltage and warm-up, with high sensitivity at low DO, yet suffer equally from membrane fouling, electrolyte depletion, and anode passivation. In both variants, calibration can shift by over 20% within two weeks in biofouling-prone environments—a significant liability for critical dissolved oxygen monitoring.
Selection criteria for aquaculture applications
Selecting a sensor for dissolved oxygen monitoring means evaluating specific field-ready features.
Biofouling resistance, salinity compensation, temperature integration
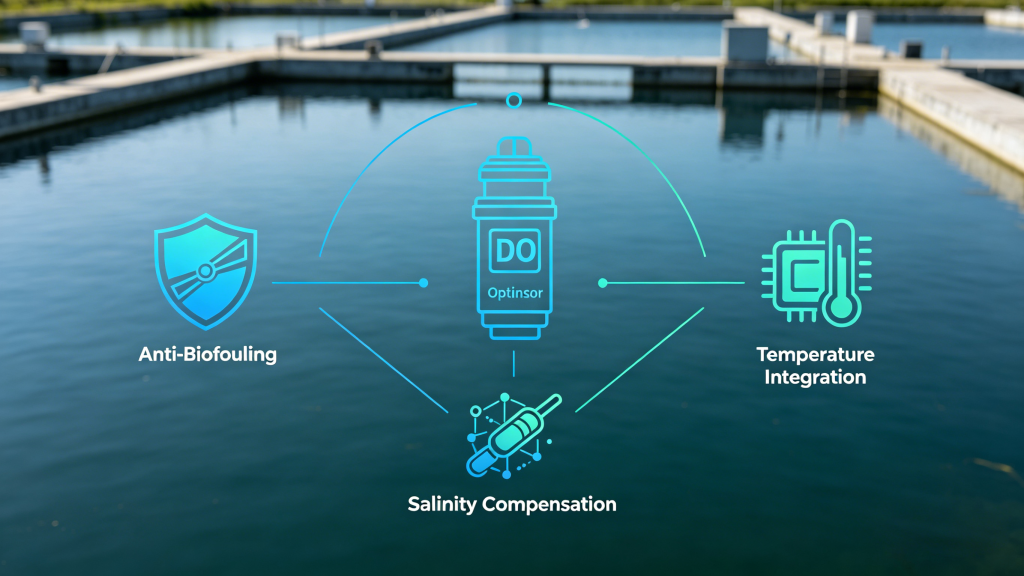
Every professional dissolved oxygen monitoring deployment must address these three criteria.
- Biofouling resistance: Barnacles, algae, and bacterial slime can blind an unprotected sensor within days. Optical sensors with flat sensing windows are inherently easier to clean, but any long-term deployment must integrate active anti-biofouling measures detailed in the maintenance section.
- Salinity compensation: Salinity reduces oxygen solubility; water with 35 ppt salinity holds roughly 20% less oxygen at saturation than freshwater at the same temperature. A dissolved oxygen monitoring sensor without salinity compensation will report dangerously inaccurate mg/L values. State-of-the-art optical sensors incorporate real-time conductivity-based compensation to ensure accuracy regardless of water source.
- Temperature integration: High-quality sensors include a fast-response thermistor and automatically correct both partial pressure and concentration outputs.
Building Your Aquaculture Dissolved Oxygen Monitoring System
Sensor placement strategies
Effective dissolved oxygen monitoring in aquaculture begins with placing sensors where they accurately represent the pond’s three-dimensional chemical gradients.
Depth profiling (surface, mid, bottom), multiple zone coverage
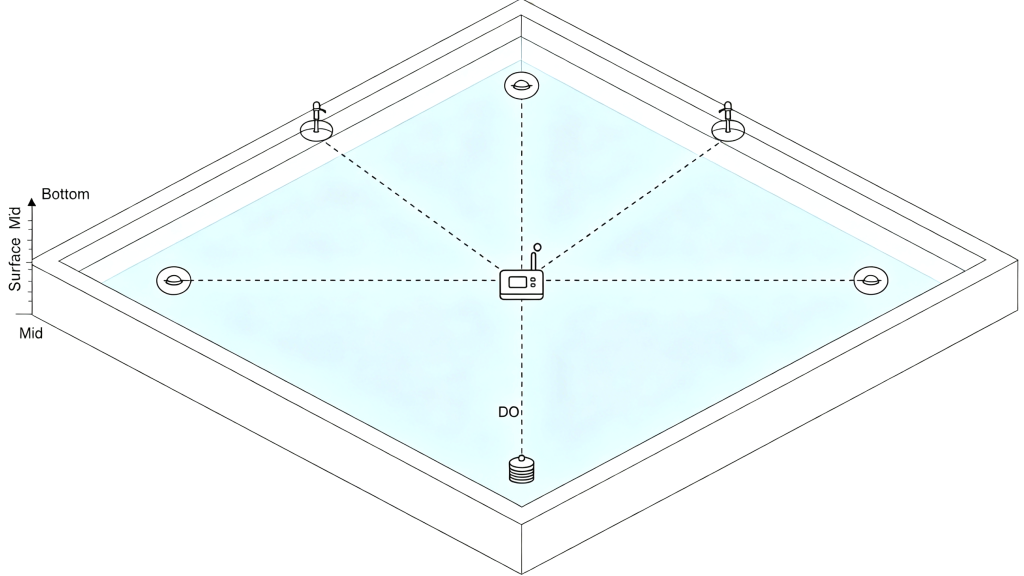
- Surface layer: Benefits from atmospheric reaeration and wind mixing, showing highest daytime DO, but least representative of the benthic environment where shrimp and demersal fish live.
- Mid-water column: Transitional environment where fish may seek thermal refuge.
- Bottom layer (critical): Sediment oxygen demand creates a permanent oxygen sink. A dissolved oxygen monitoring sensor deployed 10–20 cm above the pond bottom provides the earliest possible detection of impending hypoxia.
- Multiple zone: For large ponds, 3–5 strategically placed sensing nodes communicating to a central controller enable mapping of oxygen distribution and directing aeration precisely where needed.
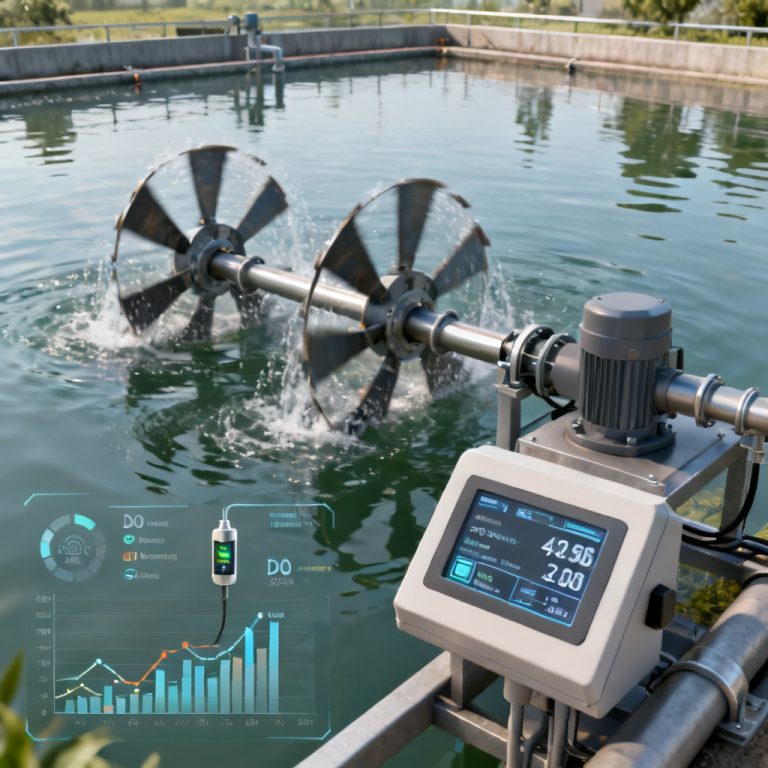
Integration with automated aeration control
Integrating real-time dissolved oxygen monitoring data with automated aeration is, as peer-reviewed literature confirms, the most impactful strategy for modern pond management.
Trigger thresholds, hysteresis settings, fail-safe design
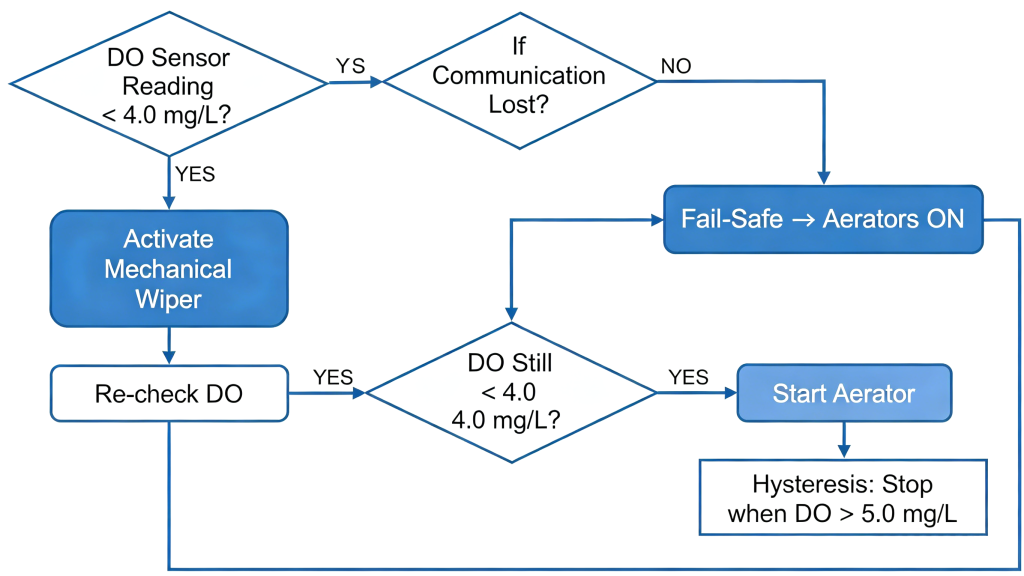
- Trigger thresholds: Define a “Warning” threshold (e.g., DO < 4.5 mg/L) that starts auxiliary aerators and an “Emergency” threshold (e.g., DO < 3.0 mg/L) that brings all aerators to maximum power without human intervention.
- Hysteresis settings: Without hysteresis, aerators rapidly toggle as DO oscillates around the set point. Proper tuning (e.g., turn on at 4.0 mg/L, off only after recovery to 5.0 mg/L) ensures stable operation.
- Fail-safe design: A properly designed automated aeration control system defaults to “aerators running” if dissolved oxygen monitoring communication is lost. Advanced systems also implement intelligent anti-fouling validation: when a DO reading dips, a wiper cleans the sensor cap; if the reading jumps back to normal, the drop was biofouling interference, and an aeration cascade is prevented.
- Variable-speed integration: Variable-speed aerators driven by real-time DO data match aeration output to biological oxygen demand, especially during critical pre-dawn hours. This turns continuous dissolved oxygen monitoring into a direct energy optimizer.
- Connectivity: Your sensor network should support native Modbus RTU, RS485, and 4–20mA outputs for direct SCADA/PLC integration without proprietary gateways.
ROI of Precision Dissolved Oxygen Monitoring: Data-Driven Case Studies
Transitioning from manual spot-checks to always-on dissolved oxygen monitoring in aquaculture requires investment, but the returns are direct and quantifiable.
Feed conversion ratio (FCR) optimization
Feed represents 50–70% of operating costs. A dissolved oxygen monitoring-driven reduction in FCR of just 0.1 can save tens of thousands of dollars per cycle.
Reducing feed waste through oxygen-based feeding schedules
When DO drops below optimal, appetite is suppressed, but uneaten feed sinks and decays. Continuous dissolved oxygen monitoring enables oxygen-based feeding: automatically reducing or pausing feed delivery when DO falls below a pre-set limit and resuming only when oxygen recovers. This reduces wasted feed and prevents the water quality crash that decomposing feed would have caused, delivering a double financial benefit.
Mortality reduction and survival rate improvement
A single severe hypoxia event can eliminate an entire crop, wiping out a year’s revenue in one night. Chronic sub-lethal effects—immune suppression and increased disease susceptibility—are equally costly but preventable with diligent dissolved oxygen monitoring.
Hypoxia event prevention savings per pond per year
A typical 0.5-hectare intensive shrimp pond carrying 12,000 kg of biomass faces a potential loss of over $60,000 if that biomass is lost to anoxia. Preventing even one major hypoxia event across multiple ponds represents an immediate ROI multiple on the entire dissolved oxygen monitoring system. Even without mortality events, farms report survival rate improvement of 3–8% after transitioning to continuous monitoring with automated early aeration, simply because animals are never allowed into prolonged respiratory stress.
Energy savings through intelligent aeration
Aeration is often the highest on-farm electricity consumer. Many farms run fixed-speed aerators on timers, wasting energy when DO is naturally high. Dissolved oxygen monitoring changes this calculus entirely.
Variable-speed aerators triggered by real-time DO data
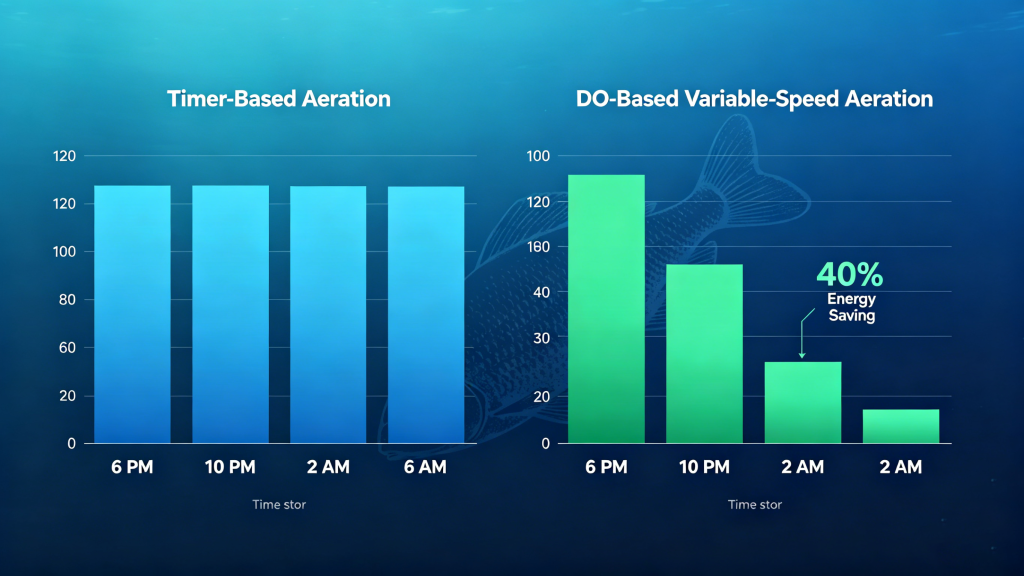
Intelligent control with variable-speed drives consumes only the energy required. At 2:00 p.m., when photosynthesis saturates the pond, aerator speed reduces to near-idle. At 4:00 a.m., as respiration pushes DO toward critical levels, the aerator ramps to full capacity. Precision dissolved oxygen monitoring-based aeration control can reduce nighttime energy consumption by 25–40% compared to fixed-speed operation, delivering permanent energy savings that offset system costs within one or two grow-out cycles.
Technical Specifications for Aquaculture Dissolved Oxygen Monitoring Sensors
When evaluating sensors for dissolved oxygen monitoring in aquaculture, specify the required technical envelope.
Key parameters
| Parameter | Specification |
|---|---|
| Measurement range | 0–20 mg/L (0–200% saturation) |
| Accuracy | ±0.1 mg/L (under stable conditions) |
| Response time (T90) | < 30 seconds |
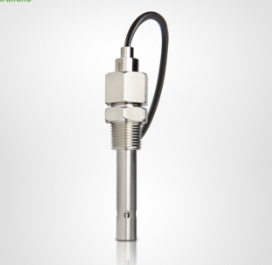
| Ingress protection | IP68 (dust-tight, protected against continuous immersion) |
| Operating temperature | 0–50°C |
| Salinity tolerance | Wetted materials (titanium, 316L stainless steel, POM) fully corrosion-resistant in saline/brackish water |
IP68 rating ensures the dissolved oxygen monitoring sensor is completely dust-tight and can withstand permanent submersion at operating depth, a critical requirement for continuous pond deployment.
Environmental durability
Beyond the parameters above, environmental durability determines the long-term success of your dissolved oxygen monitoring program. The sensor body, connector, and cable gland must all maintain integrity under constant immersion, temperature cycling, and saline exposure. High-grade materials and robust sealing are non-negotiable.
Best Practices for Sensor Installation and Maintenance in Dissolved Oxygen Monitoring
An uncompromising maintenance protocol ensures data remains trustworthy and sensor service life reaches its engineered maximum.
Anti-biofouling strategies
Biofouling is the silent destroyer of sensor accuracy in dissolved oxygen monitoring. A fouled sensor reads low, triggering false aeration cascades and eroding operator confidence.
Mechanical wipers, copper guards, cleaning frequency schedules
- Mechanical wipers: An integrated motorized brush that automatically cleans the optical sensing window is the gold standard. Intelligent dissolved oxygen monitoring systems combine wipers with validation logic: wipe, measure, then decide if intervention is needed. Learn more in our resource on biofouling prevention.
- Copper alloy guards: Copper mesh or slotted guards provide passive, continuous protection against macrofouling organisms like barnacles and mussels, extending maintenance intervals.
- Cleaning frequency: Even with automated wipers, manual inspection and gentle cloth cleaning of the sensor cap every 1–2 weeks is recommended in high-fouling tropical environments.
Calibration protocols
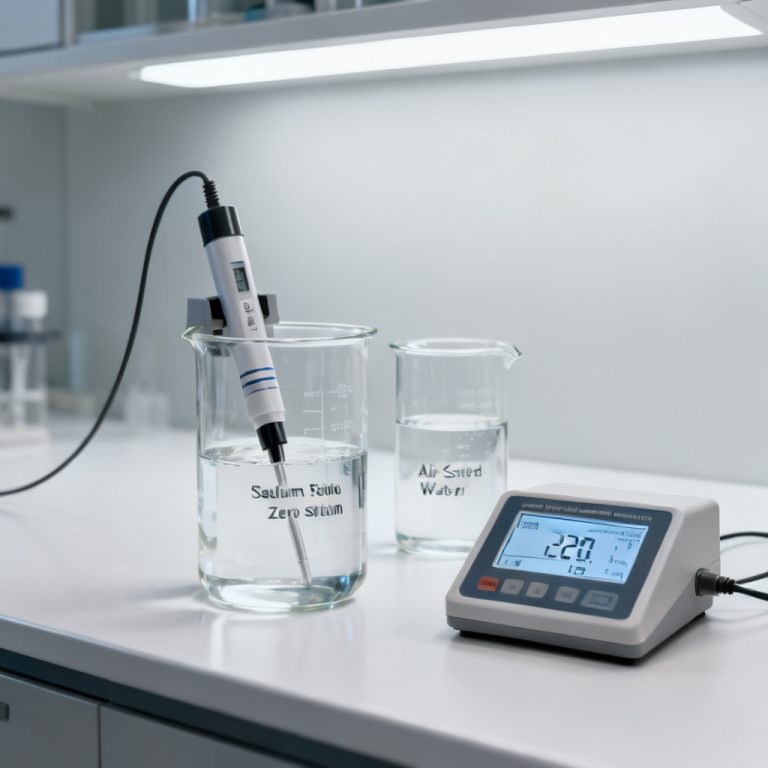
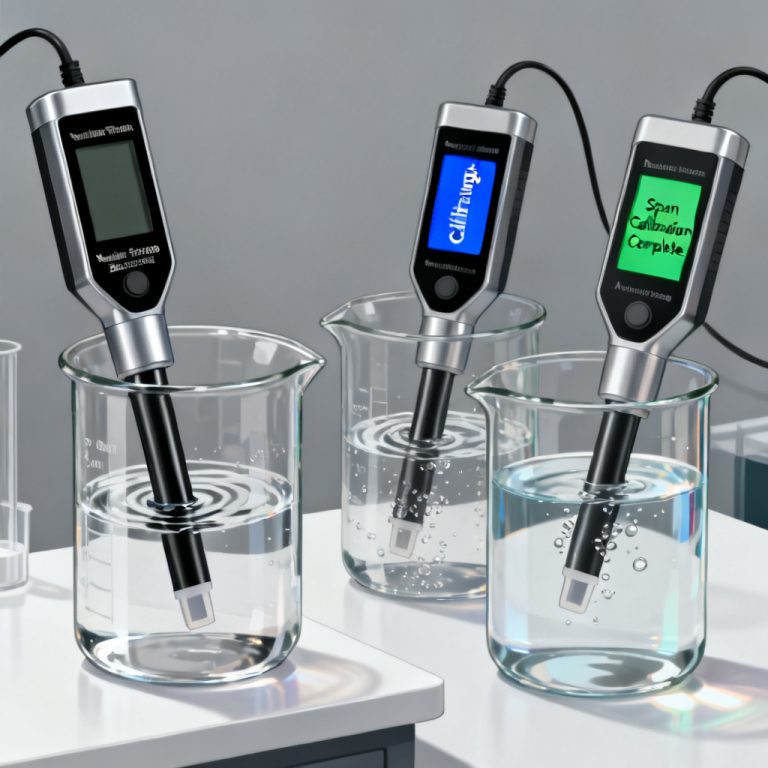
Trustworthy dissolved oxygen monitoring in aquaculture depends on a valid Calibration. Optical sensors are more stable than electrochemical types, but they are not calibration-free.
Air calibration vs. zero-oxygen solution, frequency recommendations
Frequently Asked Questions About Dissolved Oxygen Monitoring in Aquaculture
What is the ideal DO level for shrimp farming when using dissolved oxygen monitoring?
For Penaeus vannamei, maintain DO above 5 mg/L for optimal growth and FCR. Continuous dissolved oxygen monitoring helps keep the pond bottom above this threshold, preventing growth loss and Vibrio susceptibility.
How often should I calibrate my dissolved oxygen monitoring sensor?
Perform a 100% air calibration every 2–4 weeks. If you observe rapid biofouling, unexplained drift, or have gone through a severe algal bloom crash, immediately validate calibration to ensure reliable dissolved oxygen monitoring data.
Can dissolved oxygen monitoring sensors integrate with existing SCADA systems?
Yes. Modern dissolved oxygen monitoring sensors provide native Modbus RTU (RS485) and 4–20 mA outputs, enabling seamless integration with PLCs, RTUs, and cloud IoT platforms without proprietary gateways.
By architecting your dissolved oxygen monitoring in aquaculture around scientific causality, optical sensing durability, intelligent anti-fouling, and automated closed-loop control, you transform a primary production risk into a managed, optimized biological process—resulting in higher survival, lower feed costs, and predictable harvests.