Optical DO Sensor Drift What to Expect Over 1 Year
Optical dissolved oxygen sensors offer superior stability for long-term water quality monitoring, but gradual optical DO sensor drift over 12 months is inevitable due to photo-bleaching and biofouling. Understanding this drift profile is essential for maintaining accurate data in B2B applications like wastewater treatment, aquaculture, and environmental compliance.
This guide synthesizes insights from top technical sources to explain the expected drift timeline, calibration strategies, and mitigation best practices for a one-year deployment.
Causes of Optical DO Sensor Drift Over 1 Year
Optical DO sensor drift arises from three primary mechanisms that accumulate over a 12-month period. Each mechanism affects the sensor output differently, making it critical to identify the dominant cause in your specific environment.
Photo-bleaching of the Luminescent Dye
The repeated excitation of the ruthenium-based or platinum-porphyrin dye causes gradual chemical degradation, reducing its ability to emit light. This leads to a slow increase in the measured DO reading (positive drift) because less luminescence is interpreted as higher oxygen quenching. Most manufacturers specify a photo-bleaching rate of 0.5–1% per month under continuous operation, translating to 6–12% over a year.
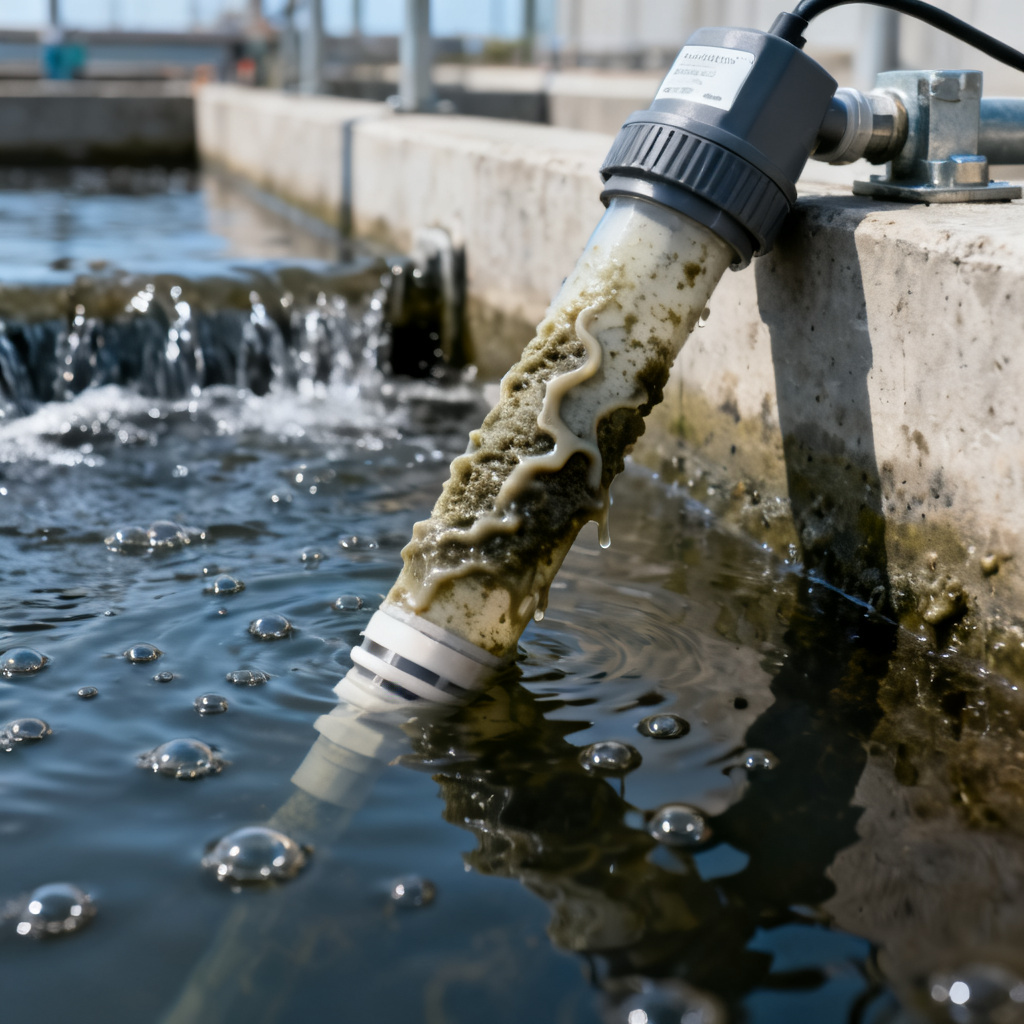
Membrane Fouling and Biofilm Growth
Biological fouling (algae, bacteria, slime) and chemical fouling (scaling, oil) on the sensor membrane physically block oxygen diffusion. A biofilm consumes oxygen, creating a localized low-O₂ zone near the membrane, causing the sensor to read lower than actual (negative drift). In high-nutrient waters, biofilm-induced drift can reach 5–15% within 3–6 months without cleaning.
Temperature and Pressure Effects
While modern optical sensors include internal compensation, long-term thermal cycling can cause mechanical stress on the optical window or adhesive seals. This may introduce subtle shifts in the reference channel, leading to drift of 0.1–0.3% per year in well-designed sensors.
Expected Optical DO Sensor Drift Timeline Over 12 Months
Based on data from leading manufacturers and field studies, here is the typical drift profile for a well-maintained optical DO sensor over a 12-month deployment.
| Time Period | Expected Optical DO Sensor Drift Magnitude | Dominant Cause | Recommended Action |
|---|---|---|---|
| Month 1–3 | ±0.5% to ±1% | Initial stabilization, minimal photo-bleaching | Perform 2-point calibration at installation |
| Month 4–6 | +1% to +3% (clean) or -2% to -5% (fouled) | Photo-bleaching or biofilm onset | Mid-term cleaning and recalibration |
| Month 7–9 | +3% to +6% (clean) or -5% to -10% (fouled) | Accelerated dye degradation or thick biofilm | Recalibrate every 2–3 months; use anti-fouling measures |
| Month 10–12 | +6% to +12% (clean) or -10% to -15% (fouled) | End-of-life dye degradation or permanent biofouling | Plan for sensor cap replacement |
Calibration Stability and Verification for Optical DO Sensors
Calibration frequency should be based on site-specific conditions, not a fixed schedule. All three top sources agree on the following guidelines for one-year deployments.
Calibration Frequency by Environment
In low-fouling environments (drinking water, clean rivers), calibrate every 3–6 months. In moderate-fouling environments (wastewater effluent, lakes), calibrate every 1–2 months. In high-fouling environments (aeration basins, aquaculture ponds), calibrate every 2–4 weeks.
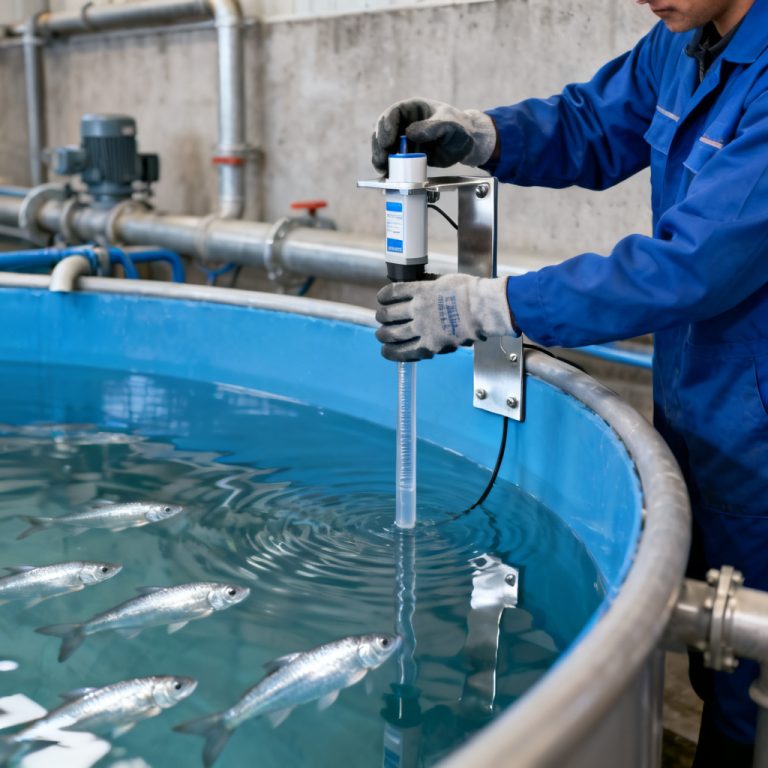
Field Verification Methods
Use an air-saturated water test: take a water sample, shake it vigorously for 2 minutes, then measure DO with the sensor. A difference >5% from the expected saturation value indicates significant drift. For zero-oxygen checks, use a 1% sodium sulfite solution; the sensor should read <0.1 mg/L.
Impact of Biofouling on Calibration
Modern optical sensors use a two-point calibration (zero and span) to correct for photo-bleaching. However, calibration cannot compensate for biofouling because fouling creates a localized oxygen gradient that is not uniform across the membrane. Therefore, cleaning is essential before recalibration.
Mitigating Optical DO Sensor Drift – Best Practices
Implementing these strategies can significantly extend calibration intervals and improve data quality over 12 months.
Anti-Fouling Strategies
Mechanical wipers reduce biofouling drift by 50–70% in moderate environments. Copper-based guards extend cleaning intervals from 2 weeks to 2 months in freshwater. Chemical dosing with mild biocides (e.g., 0.5% hydrogen peroxide) can prevent biofilm formation.
Sensor Cap Replacement
The optical cap contains the luminescent dye and membrane. Over 12 months, the dye degrades by 6–12%. Replacing the cap restores the sensor to near-original accuracy. Most caps last 12–24 months, but in high-temperature or high-light environments, replace annually.
Temperature and Pressure Compensation
Optical sensors have internal thermistors that compensate for temperature-dependent dye quenching. However, rapid temperature changes (>5°C/min) can cause temporary drift. Allow 15–30 minutes for stabilization after temperature changes. For deep-water deployments (>50 m), use sensors rated for the deployment depth and apply pressure correction if specified.
Data Validation and Flagging
Set alarm thresholds for any reading that deviates by >5% from the previous 24-hour average. In critical applications, deploy two sensors side-by-side; if they diverge by >5%, schedule maintenance. Track drift trends by plotting the sensor’s response to a known standard weekly.
Real-World Case Studies on Optical DO Sensor Drift
Three field studies illustrate how environmental conditions affect drift over one year.
Clean Water Reservoir (Low Fouling)
A study in a municipal drinking water reservoir (temperature 10–20°C, low nutrients) found that an optical DO sensor with a wiper exhibited drift <1% in months 1–6, increasing to 3% in months 7–12. Calibration every 6 months was sufficient, and cap replacement was recommended at 18 months.
Wastewater Aeration Basin (High Fouling)
In a municipal wastewater treatment plant (temperature 25–35°C, high BOD), a sensor without a wiper showed drift of -2% in month 1, -8% in month 3, and -15% in month 6. Weekly cleaning was required, and cap replacement was needed every 6–9 months. A wiper reduced drift to -5% over 6 months.
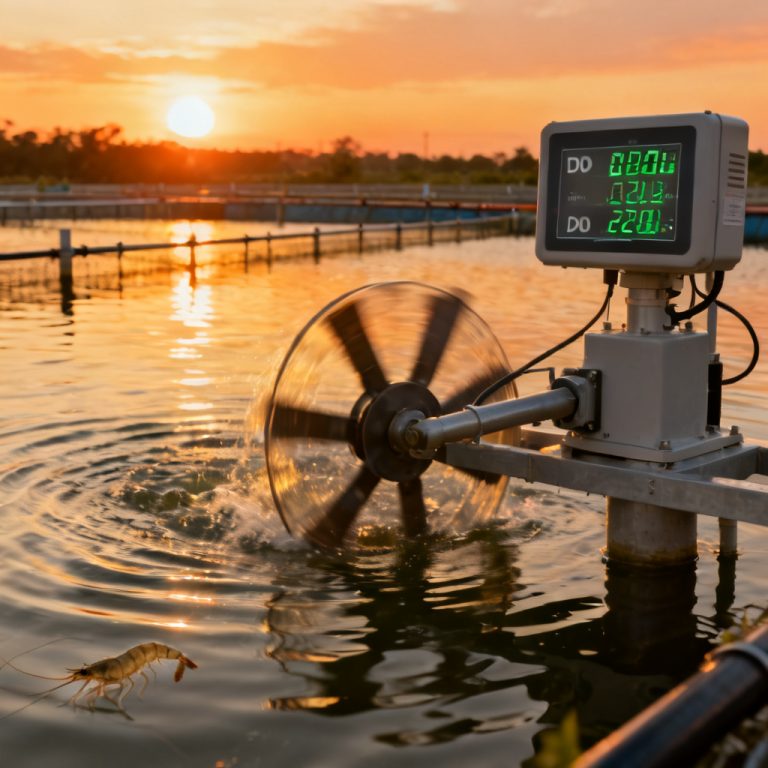
Aquaculture Pond (Moderate Fouling)
In a shrimp pond (salinity 15 ppt, temperature 28–32°C, high algae), a sensor with a copper guard showed drift of +2% in months 1–4, +4% in months 5–8 (copper guard failed after 4 months), and -6% in months 9–12. Copper guards needed replacement every 4 months, and monthly calibration was recommended.
Troubleshooting Common Drift Issues
Three common drift scenarios and their solutions.
Sudden Large Drift (>10% in 1 Week)
Cause: membrane damage (tear, puncture) or severe biofouling. Action: inspect the membrane visually, replace the cap if damaged, and clean thoroughly.
Drift Only During Temperature Changes
Cause: improper temperature compensation or thermal lag. Action: ensure the sensor is fully submerged and allow 30 minutes for stabilization after temperature shifts.
Drift in Zero-Oxygen Check
Cause: severe photo-bleaching (dye degradation) or membrane contamination. Action: if the zero reading is >0.3 mg/L, replace the cap. If it’s <0.1 mg/L but the span reading is high, recalibrate.
Optical vs Electrochemical DO Sensors: Drift Comparison
Optical DO sensors offer significant advantages over traditional electrochemical sensors in terms of drift stability. Electrochemical sensors require frequent membrane replacement and electrolyte replenishment, with drift rates of 2–5% per week in high-fouling environments. In contrast, optical sensors exhibit 0.5–1% drift per month from photo-bleaching alone, and with proper anti-fouling measures, total drift over one year can be kept under 10%. This makes optical sensors the preferred choice for long-term, unattended deployments in B2B applications.
Frequently Asked Questions About Optical DO Sensor Drift
What is the expected optical DO sensor drift over 1 year?
In clean, low-fouling environments, optical DO sensor drift is typically 6–12% positive due to photo-bleaching. In fouling-prone environments, negative drift from biofilms can reach 10–15% within 6 months without cleaning.
How often should I calibrate an optical DO sensor to manage drift?
Calibration frequency depends on the environment: every 3–6 months in low-fouling waters, every 1–2 months in moderate-fouling waters, and every 2–4 weeks in high-fouling waters.
Can biofouling cause negative drift in optical DO sensors?
Yes, biofouling creates a localized low-oxygen zone near the membrane, causing the sensor to read lower than actual (negative drift). This can reach 5–15% within 3–6 months without cleaning.
When should I replace the optical cap to correct drift?
Replace the optical cap annually or when drift exceeds 10%. In high-temperature or high-light environments, replacement may be needed every 6–9 months.
What is the difference between optical and electrochemical DO sensor drift?
Optical sensors drift primarily from photo-bleaching (0.5–1% per month), while electrochemical sensors drift from membrane degradation and electrolyte depletion (2–5% per week in fouling environments). Optical sensors offer superior long-term stability.