How to Calculate ROI of Automated DO Monitoring for Your Fish Farm
Profit in aquaculture operates with narrow margins. One of the most effective levers for widening those margins is automated DO monitoring—yet many farm managers hesitate because the upfront investment looks substantial next to a handheld meter. The question every farm owner eventually asks is: “How long until this system pays for itself?”
This page gives you a transparent, four-step method to calculate the return on investment (ROI) of automated DO monitoring for your specific operation. It draws on published field data, documented case studies, and operational cost benchmarks from active aquaculture facilities. No vague promises—just the numbers and the formulas you need to build your own business case.
Step 1: Calculate What You Currently Spend on Manual DO Testing
Automated DO monitoring ROI is calculated against your status quo. If you are still relying on handheld meters and manual spot-checks, you are incurring costs that often don’t appear as a single line item in the books—but they add up quickly.
Labor cost. A single pond monitored for dissolved oxygen, pH, temperature, ammonia, and salinity/conductivity requires approximately 100 minutes per test round when you factor in walking to the pond, sampling, running each test, recording results, and cleanup. At two tests per day (morning and afternoon), that is 3.3 hours daily, or roughly 1,205 hours annually per pond. With an aquaculture technician wage of $18/hour, a single pond costs approximately $21,690/year in labor for water testing alone. For a five-pond operation, even with batching efficiencies cutting the total by half, annual labor still approaches $54,000—essentially one full-time employee doing nothing but water testing.
And here is the hidden cost most budgets ignore: water quality does not take weekends off. Weekend and holiday coverage typically adds 15–25% to the effective labor burden.
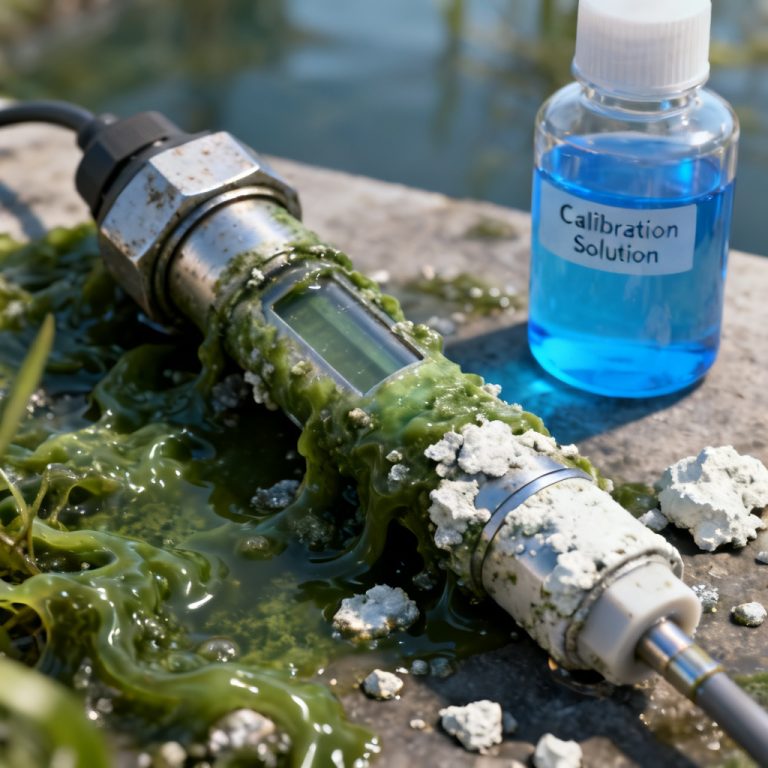
Consumables and equipment. Manual testing means a continuous outflow on reagents and replacement parts. pH test kits ($20–50 per kit, replaced monthly at two tests/day), ammonia test kits ($15–40 per kit, similar replacement cycle), handheld DO meter membrane caps and electrolyte replacement ($100–200/year), and calibration solutions ($50–100/year). A reasonable annual budget for manual testing consumables is $500–$1,500 per pond. For a five-pond operation, that is $2,500–$7,500/year in supplies alone—before accounting for the handheld meter itself ($300–$800 for a decent unit, with replacement every 2–3 years).
Hidden costs. The largest hidden expense is not labor or consumables—it is information gaps. Manual testing at 8 AM and 4 PM generates two data points in a 24-hour period. What happened at 3 AM, when algal respiration peaks and dissolved oxygen bottoms out, is unknown. A failed aerator at midnight goes undetected until the morning walkthrough. Delayed detection of a DO crash is not a cost you can spreadsheet easily—until you stare at a pond of dead fish at sunrise.
Step 2: Quantify What Suboptimal DO Is Already Costing You
Even if you have never experienced a catastrophic hypoxia event, automated DO monitoring reveals that suboptimal dissolved oxygen is silently eroding your margins through three measurable channels.
Feed conversion ratio (FCR) degradation. Feed represents 50–70% of total variable costs in intensive aquaculture. When dissolved oxygen drops below optimal thresholds, fish and shrimp suppress metabolic activity and reduce or cease active feeding. Feed pellets sink unconsumed, where anaerobic decomposition drives ammonia and hydrogen sulfide concentrations upward. The result is a compounding cascade: uneaten feed degrades water quality, which further suppresses DO, which further depresses feeding behavior.
The numbers are stark. Research indicates that when DO falls below 4 mg/L, fish feeding rates can drop by approximately 30%. A well-managed Pacific white shrimp system under normoxic conditions can achieve FCR values of 1.2–1.4; drop DO below 4.0 mg/L, and those values degrade rapidly. A 0.1 improvement in FCR—achievable by maintaining DO consistently above 5 mg/L—can save a 100-tonne-per-year operation over $15,000 annually in feed costs alone. For a deeper understanding of the FCR-DO relationship, see our complete guide on dissolved oxygen monitoring in aquaculture.
Mortality risk. A single severe hypoxia event can eliminate an entire crop. A 0.5-hectare intensive shrimp pond carrying 12,000 kg of harvestable biomass represents a potential loss of over $60,000 in a single night. Even sub-lethal levels cause chronic stress, increased susceptibility to Vibrio infections, and measurable survival rate decline at harvest. Farms that transition from manual testing to continuous automated monitoring consistently report survival rate improvement of 3–8%—not because they eliminated a major kill event, but because the stock was never allowed to languish in prolonged respiratory stress.
Energy waste. Many farms run aerators on conservative, timer-based schedules—essentially buying insurance against the unknown. When you can’t see what the DO is doing at 2 AM, you run the paddlewheels all night, every night. Continuous monitoring with optical fluorescence technology flips this logic: aerators run only when data says they need to run. Real-world case evidence shows that DO-based automated aeration can reduce nighttime energy consumption by 25–40% compared to continuous timer-based operation, with some integrated monitoring and control systems in land-based facilities achieving oxygen consumption and electricity savings of 50–75% compared to continuous supply, translating to annual savings exceeding €350,000 across the whole facility.
Step 3: Determine Your System Cost
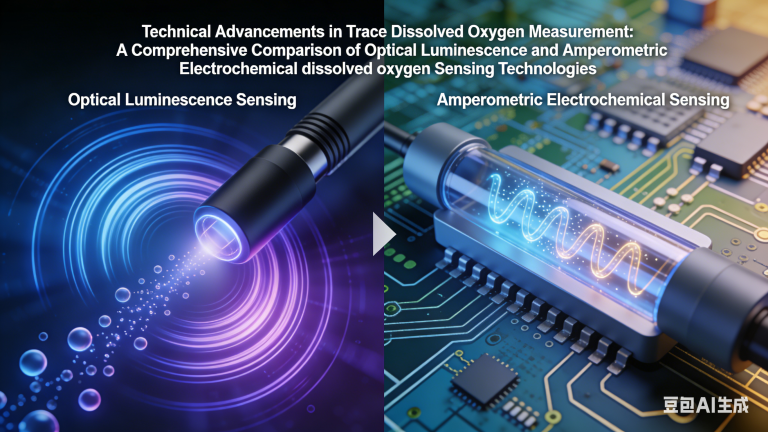
An automated dissolved oxygen monitoring system requires a one-time hardware investment and modest ongoing costs. The engineering specifications of the sensor are critical to total cost of ownership. For a detailed technical comparison of sensor technologies, refer to our dedicated resource on optical vs. electrochemical DO sensors for aquaculture.
For medium to large-scale operations, the key cost categories are:
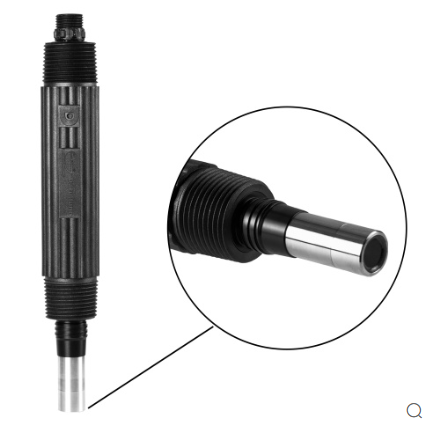
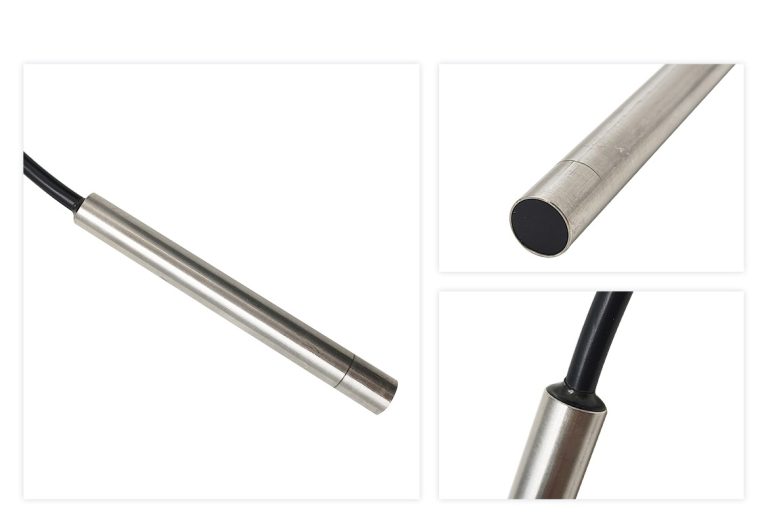
- Sensor hardware per monitoring station, with optical dissolved oxygen sensors offering longer service life
- Controller/gateway with cellular or Wi-Fi connectivity
- Installation and mounting hardware
- Annual ongoing costs: sensor cap replacement (typically every 1–2 years for quality optical sensors), cellular data plans ($20–30/month per station), and calibration maintenance
The choice of sensor technology significantly impacts long-term costs. Optical fluorescence sensors eliminate membrane and electrolyte consumables, reducing operational burden compared to traditional electrochemical types. For operations across multiple ponds, per-station costs decrease with scale due to shared connectivity infrastructure.
Step 4: Calculate Your Payback Period
With your current costs quantified, your suboptimal DO losses estimated, and your system cost determined, the automated DO monitoring ROI calculation becomes a straightforward formula:
Annual Savings = (Reduced labor cost) + (Consumables eliminated) + (FCR improvement value) + (Energy savings) + (Mortality reduction value)
Payback Period (years) = Total System Cost ÷ Annual Savings
3-Year ROI = (Annual Savings × 3 − Total System Cost) ÷ Total System Cost × 100%
A Worked Example: 10-Pond Intensive Shrimp Farm
To make this concrete, here is a cost comparison for a 10-pond intensive shrimp operation, based on published operational benchmarks. The figures below compare manual testing against automated DO monitoring over a three-year period.
| Cost Category | Manual Testing (Annual) | Automated Monitoring (Annual) |
|---|---|---|
| Labor (2 full-time technicians) | $74,880 | Minimal; routine calibration only |
| Consumables (reagents, membranes, calibration solutions) | $10,000 | $1,500 (sensor caps, calibration) |
| Cellular/data connectivity | $0 | $2,400 |
| Overtime/holiday premium | $11,232 | $0 |
| FCR improvement (0.1 reduction across 10 ponds) | $0 (baseline) | +$15,000 (saved) |
| Energy savings (25% reduction in nighttime aeration) | $0 (timer-based baseline) | +$4,000 (saved) |
| Mortality event prevention (one major event avoided per year) | Risk of $60,000+ loss | Prevented |
Hardware investment for the automated system is one-time; ongoing costs average approximately $3,900 per year for a 10-pond configuration. Against this, annual savings from labor, consumables, FCR improvement, and energy reduction total over $92,000—meaning the system pays for itself within the first grow-out cycle. Over a three-year period, total savings exceed $200,000 compared to continued manual testing.
Even if your operation is smaller—say, two or three ponds—the labor and consumable savings alone typically achieve full payback within 12–18 months, before accounting for the mortality and FCR benefits.
What Drives the Fastest Payback?
The farms that achieve the fastest ROI on automated DO monitoring share three characteristics:
They integrate aeration control. Connecting DO sensors directly to aerator relays eliminates the dangerous gap between “the alarm went off” and “someone turned on the paddlewheels.” Fail-safe designs default to aerators running when communication is lost, ensuring that a sensor fault does not cause a kill event.
They use DO data to drive feeding decisions. When DO drops below optimal thresholds, automated feeders can be programmed to reduce or pause feed delivery, preventing the double loss of wasted feed and the water quality crash that uneaten feed causes. Published case data shows farms reducing feed costs by 15% by adjusting feed dosages based on real-time DO levels.
They choose sensor technology designed for low maintenance. Optical sensors with integrated mechanical wipers and anti-biofouling strategies—including copper-alloy guards and automated cleaning intervals—maintain data accuracy without the weekly calibration and membrane replacement burden of electrochemical alternatives.
Your Numbers, Your Spreadsheet
The four-step framework above is designed to be populated with your own farm’s actual costs. Every operation differs in labor rates, energy prices, feed costs, stocking densities, and risk tolerance. A farm in Southeast Asia operating tilapia ponds with low-cost labor will have a different ROI profile than a RAS salmon facility in Norway with high electricity rates and premium harvest values.
What is universal is the directional math: manual testing is far more expensive than it appears on the surface, suboptimal DO has been silently costing you money every production cycle, and automated DO monitoring pays for itself faster than most operators expect—often before the first harvest after installation.
For a detailed analysis of which sensor technology delivers the best long-term economics, see our comparison of optical vs. electrochemical DO sensors for aquaculture.