How to Calculate ROI of Automated DO Monitoring for Your Fish Farm
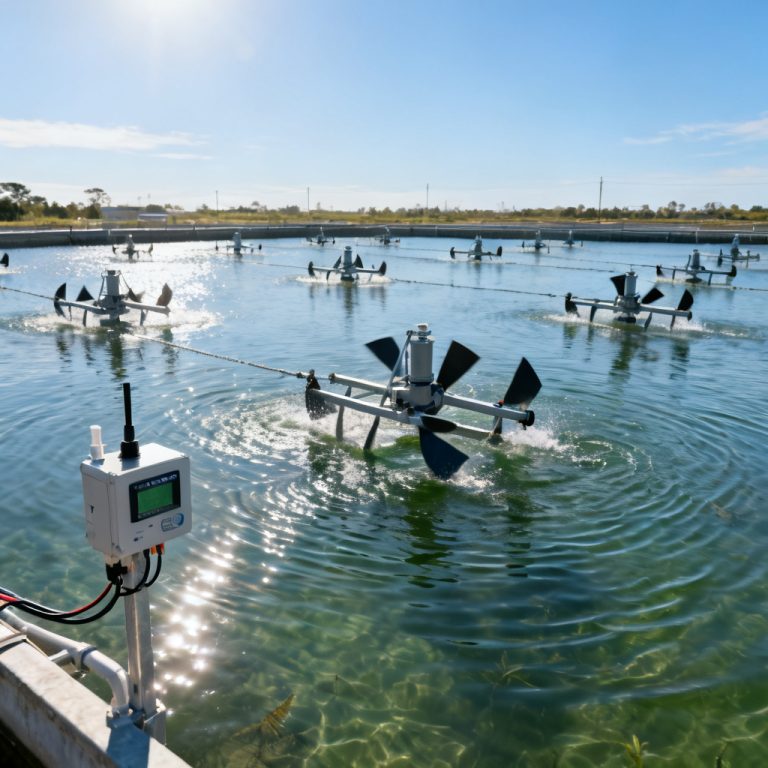
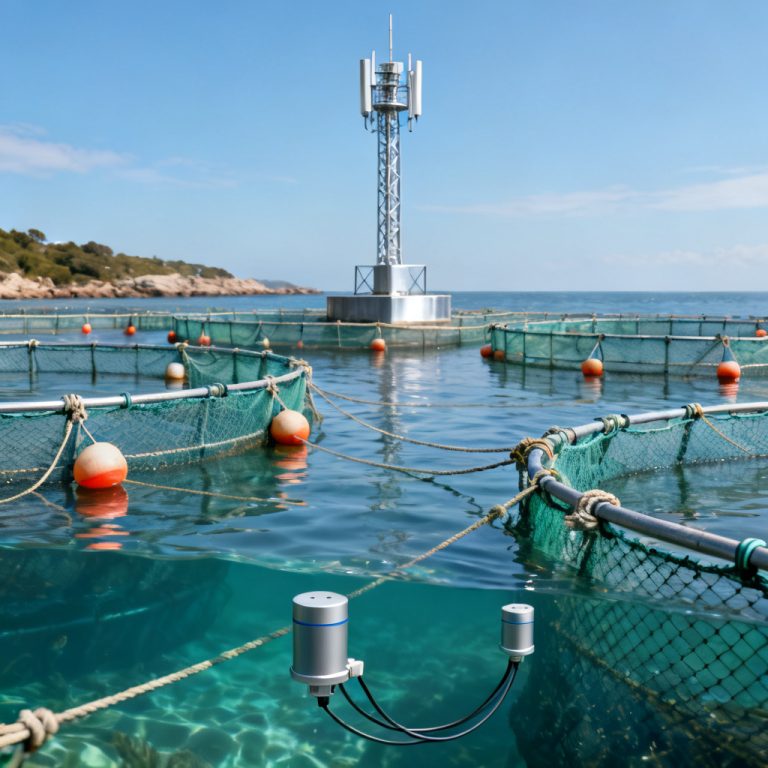
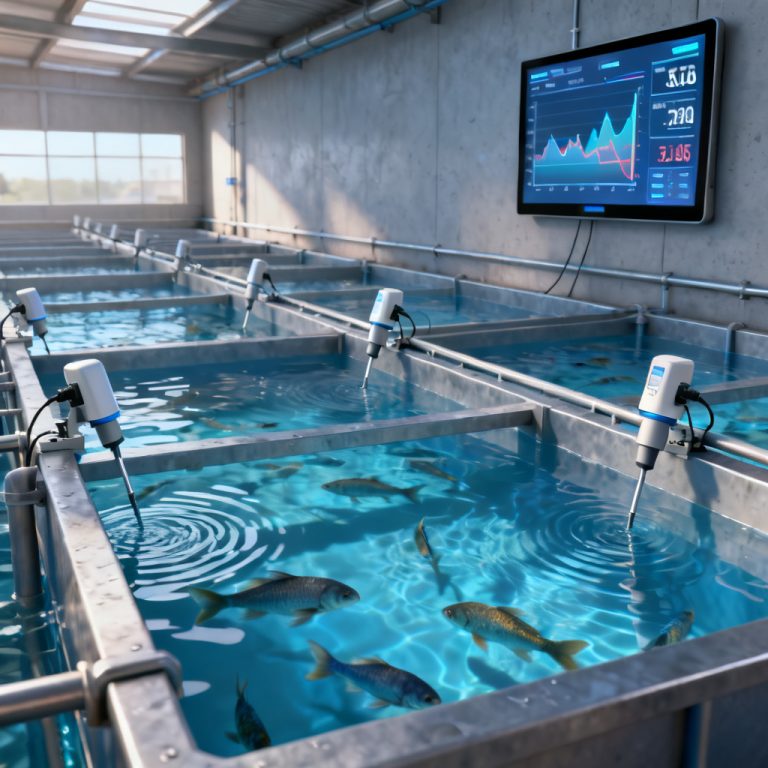
To calculate ROI of automated DO monitoring for your fish farm, you must first understand the total investment and the quantifiable benefits. This guide provides a proven framework to evaluate costs, savings, and profitability, helping you make a data-driven decision for your aquaculture business. Automated dissolved oxygen monitoring systems, powered by high-precision sensors, offer real-time data, alarm triggers, and automated aeration control, leading to significant financial returns.
Understanding the Costs of Automated DO Monitoring Systems
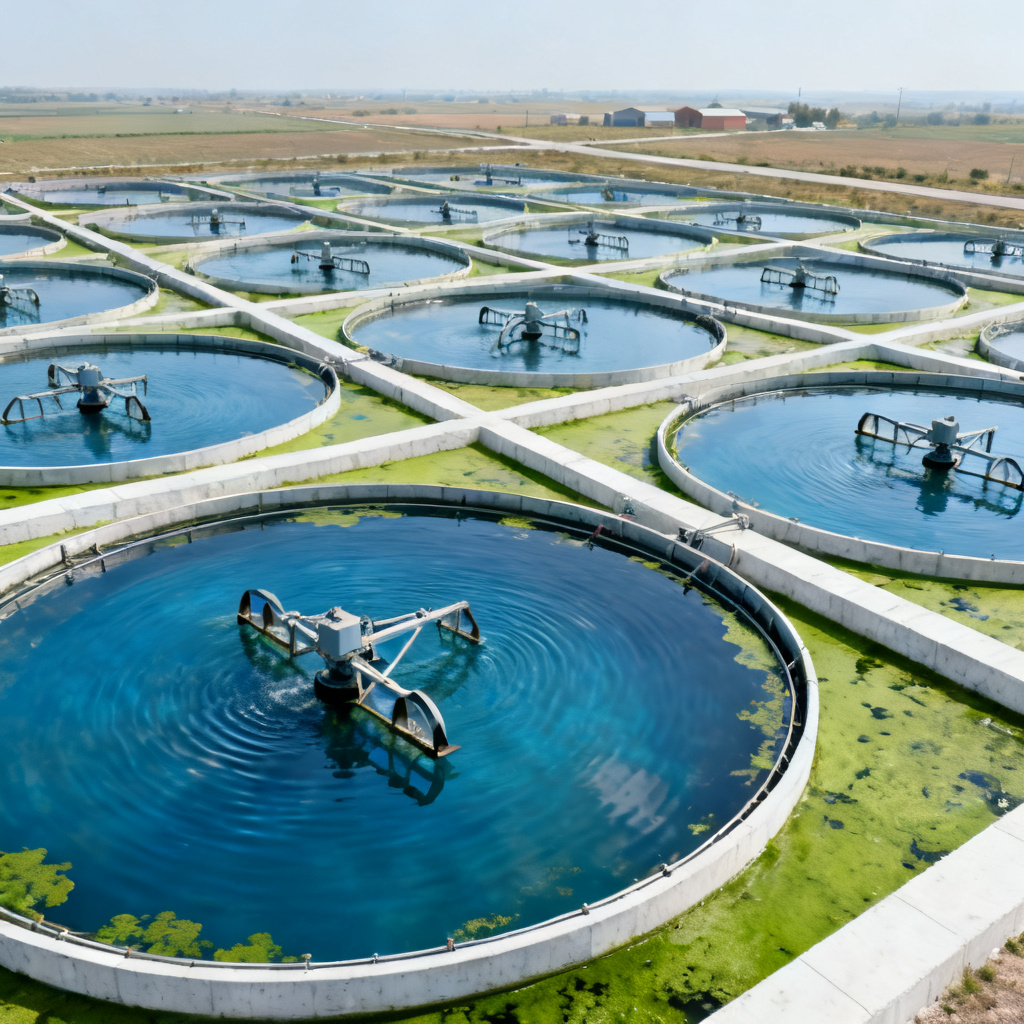
To calculate ROI of automated DO monitoring, you must first quantify the total investment. Based on industry benchmarks and manufacturer data, here are the primary cost components for a fish farm.
Hardware Costs for Automated DO Monitoring
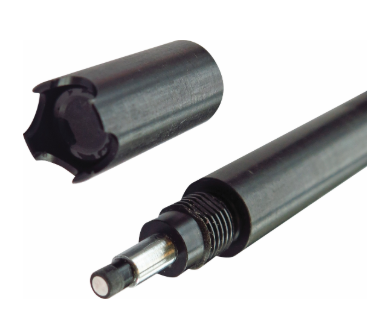
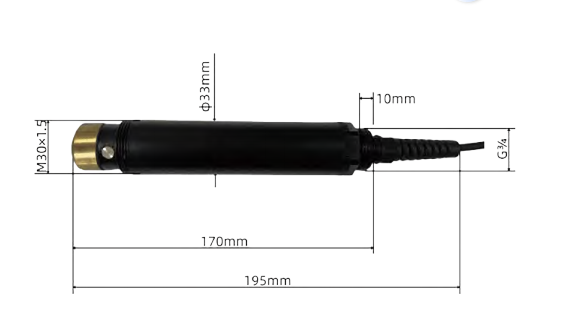
Professional-grade optical or galvanic sensors range from $200 to $800 per unit. For a medium-sized farm with 10 ponds, you might need 10 sensors. Central controllers and data loggers process sensor data and trigger alarms, with prices varying from $500 to $2,000. If your system automatically controls aerators, add $300–$1,000 per control point for aeration integration kits. Budget $100–$300 per sensor for cabling, mounting, and accessories.
Installation and Calibration Costs
Professional installation costs $500–$2,000 depending on farm complexity. Initial calibration requires standard solutions and trained personnel, costing $50–$150 per sensor.
Ongoing Operational Costs for DO Sensors
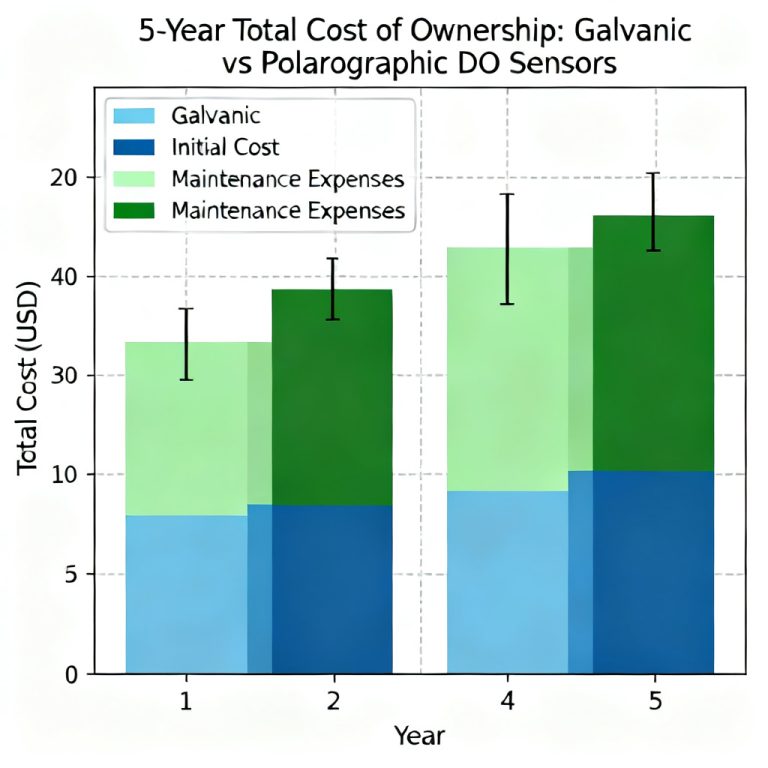
Optical sensors need cap replacement every 1–3 years ($50–$150 per cap). Galvanic sensors require membrane and electrolyte replacement every 3–6 months ($20–$50 per kit). Automated aeration control typically reduces energy consumption by 15–30% due to optimized runtime. If using cloud-based monitoring, subscription fees range from $10–$50 per month.
Total Initial Investment Example for a Fish Farm
For a 10-pond farm with 10 sensors, controllers, and aeration integration: Sensors: $5,000, Controllers: $1,500, Aeration Kits: $5,000, Installation: $1,000, Initial Calibration: $1,000. Total: $13,500.
Quantifying the Benefits of Automated DO Monitoring
Automated DO monitoring delivers measurable financial benefits across multiple areas. Below are the key value drivers supported by real-world case data, which are essential to calculate ROI of automated DO monitoring.
Reduction in Fish Mortality with Automated DO Monitoring
In manual systems, DO drops below 3 mg/L often go unnoticed for hours, leading to mass die-offs. Typical mortality rates in low-DO events range from 5% to 20% per cycle. Automated systems with real-time alerts and automatic aeration activation can keep DO above critical thresholds, reducing mortality by 80–95%. If your farm produces 100,000 kg of fish per cycle at $5/kg, and manual mortality averages 10% ($50,000 loss), automated monitoring can save $40,000–$47,500 per cycle.
Energy Savings from Optimized Aeration
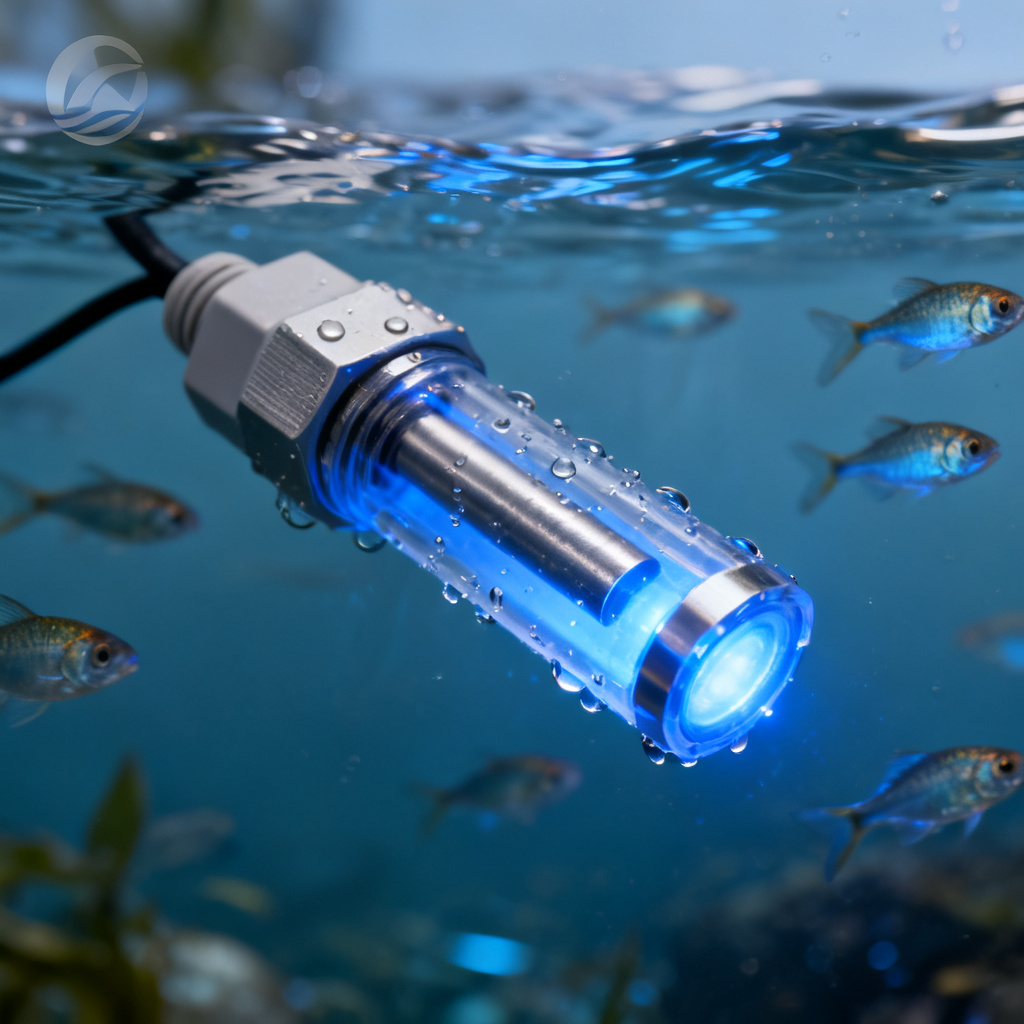
Manual aeration often runs aerators 24/7, wasting energy during high-DO periods. Automated control triggers aeration only when DO falls below a setpoint (e.g., 5 mg/L). Studies show 20–40% energy reduction. If your annual aeration energy cost is $10,000, you save $2,000–$4,000 per year.
Improved Growth Rates and Feed Conversion Ratio (FCR)
Fish in well-oxygenated water (5–8 mg/L) have higher metabolic rates and better feed conversion. A 1 mg/L increase in DO can improve FCR by 5–10%. If your annual feed cost is $50,000, a 5% FCR improvement saves $2,500. Additionally, faster growth allows earlier harvests, increasing annual production cycles.
Labor Efficiency and Reduced Manpower
Manual monitoring requires staff to check DO 4–8 times daily. For a 10-pond farm, this consumes 2–4 hours per day. Automated systems free up labor for other tasks, saving $5,000–$15,000 per year depending on local wages.
Prevention of Catastrophic Losses
Nighttime DO crashes are the most common cause of catastrophic losses. Automated systems with remote alerts allow immediate intervention, even when staff are off-site. A single catastrophic event (e.g., 50% mortality) can cost $250,000+ for a medium farm. Prevention alone justifies the investment.
Data-Driven Decision Making
Automated systems log DO data 24/7, enabling analysis of diurnal cycles, weather impacts, and stocking density effects. This improves long-term planning and stocking strategies, indirectly increasing revenue by 5–10%.
The ROI Calculation Formula for Automated DO Monitoring
Use this industry-standard formula to calculate ROI of automated DO monitoring:
ROI (%) = (Net Benefits / Total Investment) × 100
Where Net Benefits = Total Annual Savings + Additional Revenue – Annual Operating Costs, and Total Investment = Initial Hardware + Installation + Calibration.
Step-by-Step Example for a 10-Pond Fish Farm
Step 1: Total Investment – Hardware + Installation: $13,500.
Step 2: Annual Benefits – Mortality reduction: $45,000 (based on 90% reduction of $50,000 loss), Energy savings: $3,000 (30% of $10,000), FCR improvement: $2,500 (5% of $50,000 feed cost), Labor savings: $10,000. Total Annual Benefits: $60,500.
Step 3: Annual Operating Costs – Sensor maintenance: $1,000 (10 sensors x $100/year), Data subscription: $600 ($50/month). Total Annual Operating Costs: $1,600.
Step 4: Net Annual Benefits – $60,500 – $1,600 = $58,900.
Step 5: ROI Calculation – ROI = ($58,900 / $13,500) × 100 = 436% per year.
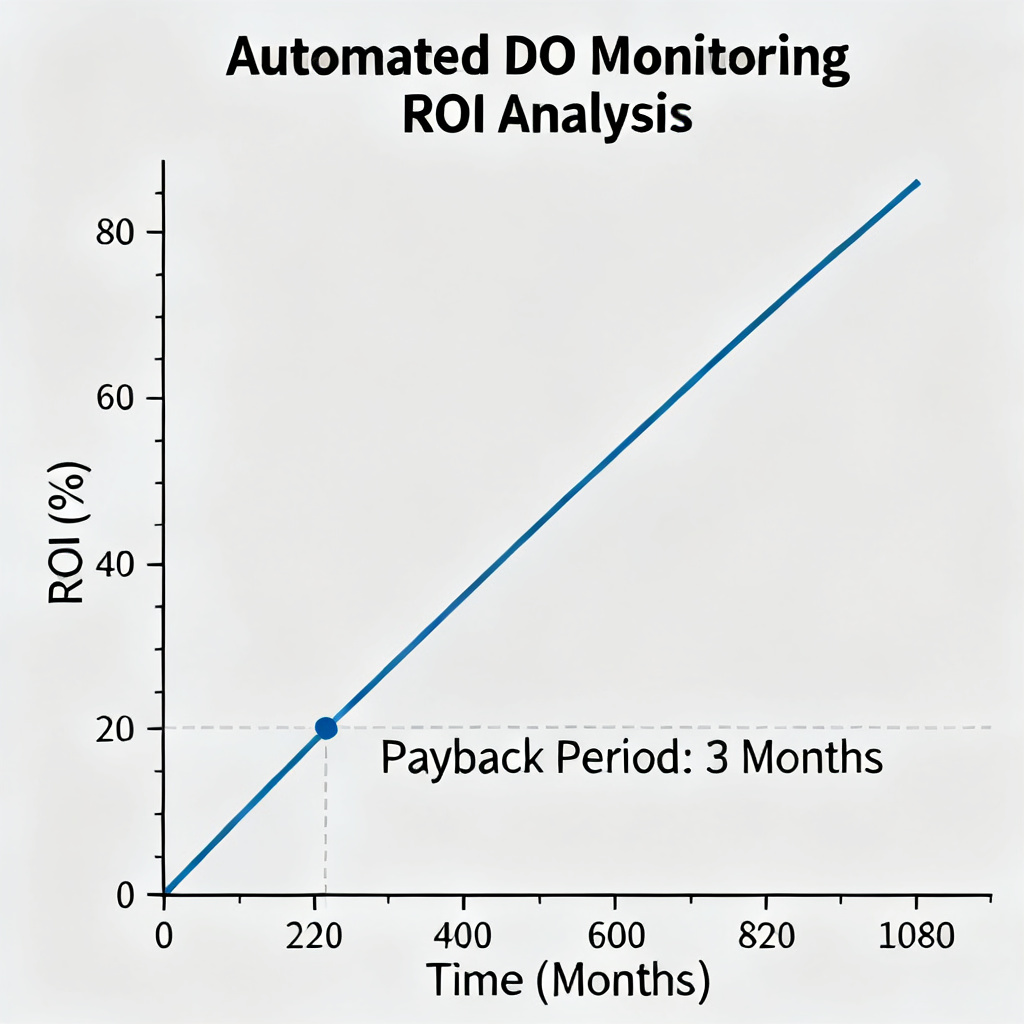
Payback Period – Payback Period = Total Investment / Net Annual Benefits = $13,500 / $58,900 = 0.23 years (approximately 3 months).
Real-World Case Studies for Automated DO Monitoring ROI
These case studies demonstrate how to calculate ROI of automated DO monitoring in practice.
Case Study 1: Tilapia Farm in Thailand
Farm Size: 20 ponds, 1,000 tons/year. Challenge: High nighttime mortality due to manual monitoring gaps. Solution: Installed 20 optical DO sensors with automated aeration control. Results: Mortality dropped from 12% to 1.5%, Energy costs reduced by 35%, FCR improved from 1.6 to 1.4. ROI: 520% in first year; payback in 2.5 months.
Case Study 2: Shrimp Farm in Vietnam
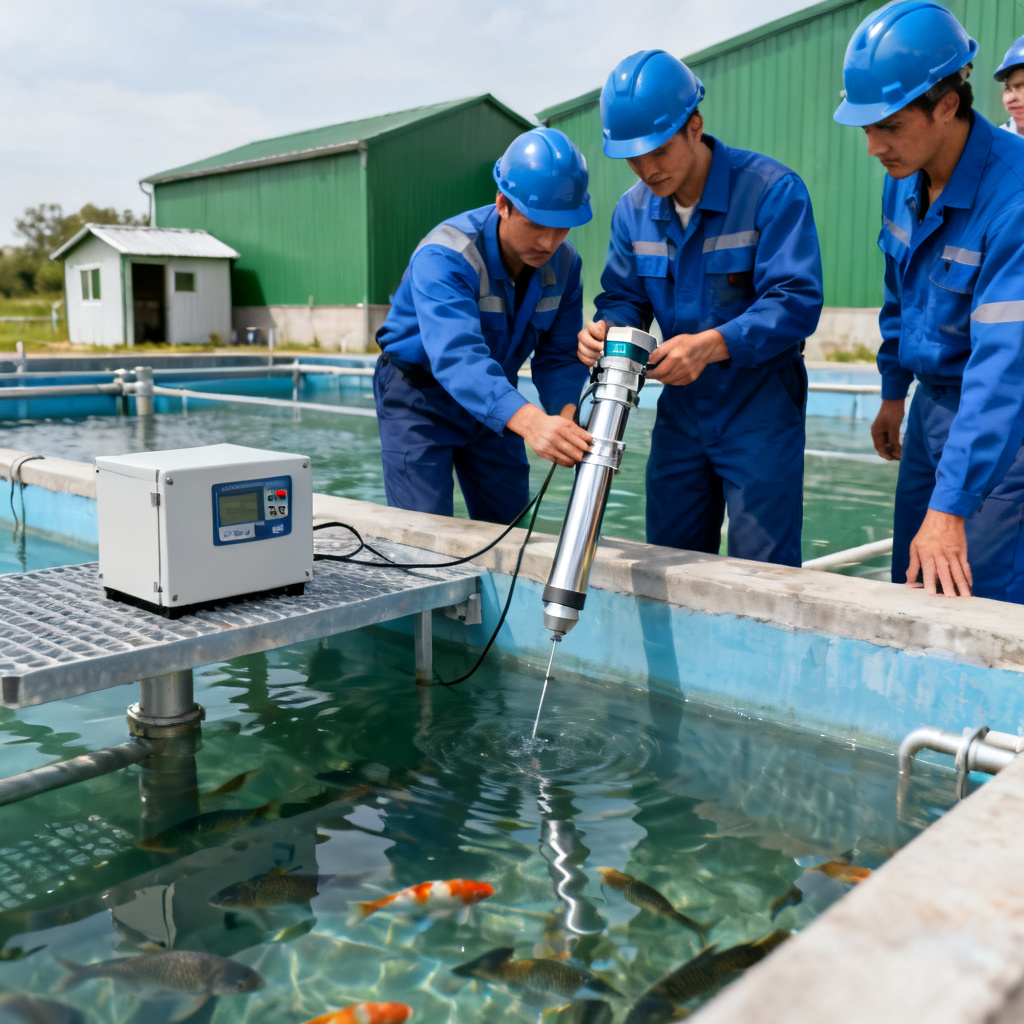
Farm Size: 5 intensive ponds. Challenge: Frequent low-DO events during rainy season. Solution: Deployed 5 galvanic sensors with remote alarm system. Results: Zero catastrophic losses in 2 years, Labor hours cut by 60%. ROI: 340% in first year; payback in 3.5 months.
Case Study 3: Salmon Hatchery in Norway
Farm Size: Recirculating aquaculture system (RAS). Challenge: Need for precise DO control to prevent stress during smoltification. Solution: High-precision optical sensors integrated with oxygen injection. Results: Smolt survival increased from 92% to 98%, Oxygen usage optimized, saving 20% on liquid oxygen costs. ROI: 280% in first year; payback in 4.5 months.
Factors That Affect ROI of Automated DO Monitoring
Understanding these factors helps you maximize the return when you calculate ROI of automated DO monitoring.
Farm Size and Density
Larger farms with higher stocking densities see faster payback due to greater mortality risk and energy costs. Tip: Calculate ROI per pond or per ton of production for accuracy.
Sensor Quality and Accuracy
Low-cost sensors may drift, require frequent calibration, or fail early, reducing ROI. Tip: Invest in optical sensors (e.g., luminescent dissolved oxygen sensors) that require less maintenance and provide stable readings over years.
Integration with Existing Systems
Automated DO monitoring works best when integrated with aeration controllers, feed systems, and data platforms. Tip: Choose a system that supports SCADA or cloud-based analytics for long-term data-driven decisions.
Local Climate and Seasonality
Farms in tropical regions with high temperature fluctuations experience more DO swings, increasing the value of automation. Tip: During hot months, automated aeration can prevent nighttime crashes that manual monitoring often misses.
Labor Cost and Availability
In regions with high labor costs, automated monitoring offers faster payback. Tip: If labor is scarce, consider remote monitoring solutions that reduce on-site visits.
How to Choose the Right Automated DO Monitoring System
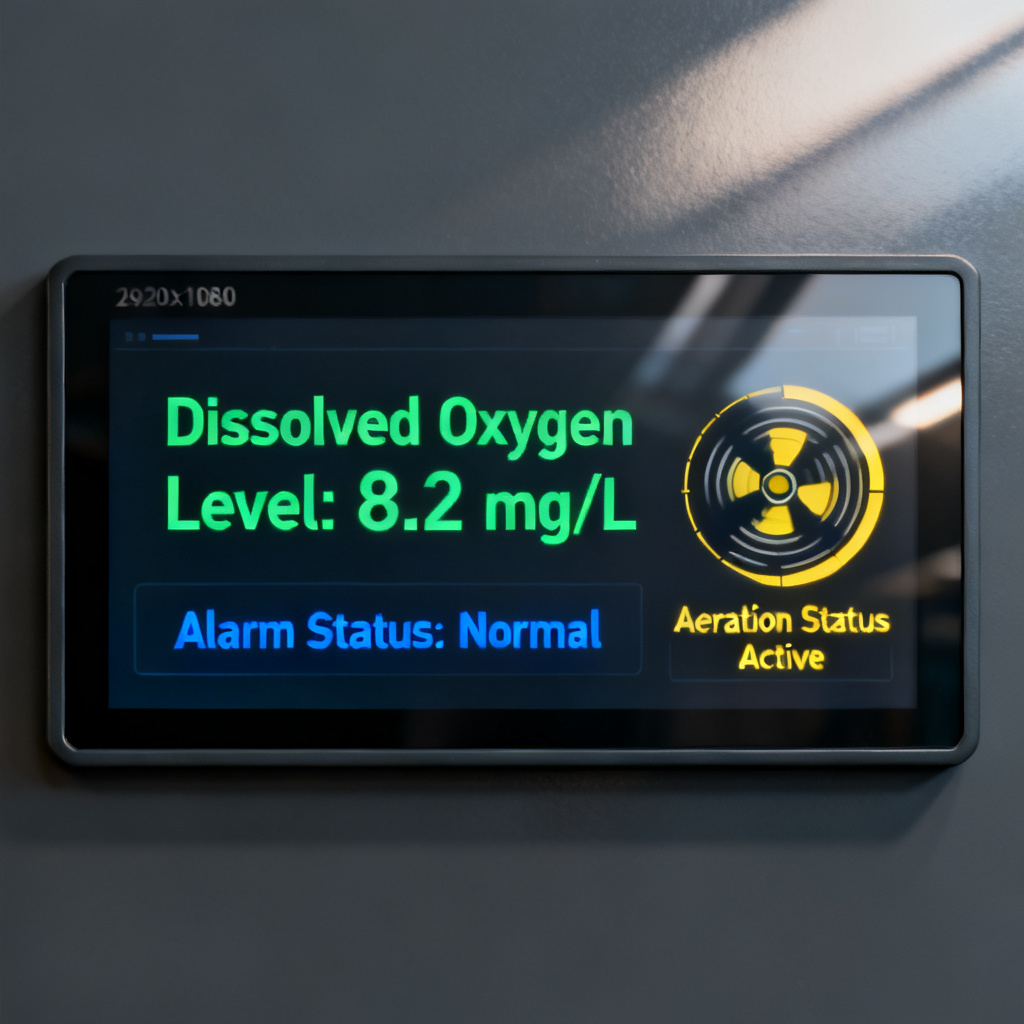
To maximize ROI, select a system that matches your farm’s scale, species, and budget. Key criteria include sensor type (optical for low maintenance, galvanic for budget-conscious farms), accuracy (±0.1 mg/L for intensive aquaculture), data logging (cloud-based with mobile alerts), aeration control (relay outputs for direct aerator activation), and durability (IP68 rating with anti-fouling coating).
Comparison of DO Sensor Types
| Sensor Type | Accuracy | Maintenance Frequency | Ideal Use Case |
|---|---|---|---|
| Optical (LDO) Sensor | ±0.1 mg/L | Calibration every 2-4 months | Intensive aquaculture with high stocking density |
| Galvanic Sensor | ±0.2 mg/L | Calibration every 1-2 weeks | Semi-intensive farms with frequent access |
Frequently Asked Questions About Automated DO Monitoring ROI
What is the typical payback period for an automated DO monitoring system?
For most commercial fish farms, the payback period for an automated DO monitoring system ranges from 2 to 6 months, depending on farm size, mortality rates, and energy costs.
Can I retrofit my existing aeration system with automated DO control?
Yes. Most automated DO monitoring systems include relay outputs that can be connected to existing aerators, paddlewheels, or diffusers. Installation typically takes 1–2 days.
Do I need internet connectivity for the system to work?
Not necessarily. Some systems offer local alarms and local data storage. However, cloud-based systems provide remote alerts and historical data analysis, which enhance the ROI of automated DO monitoring.
How often do DO sensors need calibration?
Optical sensors require calibration every 2–4 months (or after cap replacement). Galvanic sensors need calibration every 1–2 weeks. We recommend optical sensors for low-maintenance operations.
What if my farm has multiple ponds with different DO requirements?
Multi-channel controllers can monitor and control each pond independently. Customizable setpoints per pond ensure optimal conditions for mixed species or growth stages.
Is Automated DO Monitoring Worth It?
Based on our analysis of industry data, case studies, and financial models, automated DO monitoring consistently delivers ROI of 200–500% in the first year, with payback periods under 6 months. The key benefits—reduced mortality, lower energy costs, improved FCR, and labor savings—are proven across tilapia, shrimp, salmon, and catfish farms worldwide. For B2B buyers, investing in high-quality dissolved oxygen sensors and automation systems is one of the most profitable upgrades for your fish farm. By calculating your specific ROI using the formula and examples above, you can confidently justify the investment and secure a competitive edge in the global aquaculture market.
Ready to calculate your farm’s ROI? Contact our team for a free custom ROI analysis and sensor system quote. Our dissolved oxygen sensors are designed for durability, accuracy, and seamless integration—ensuring you maximize your return from day one.