DO Sensor Integration with SCADA Systems for Fisheries: Complete Guide
DO sensor integration with SCADA systems for fisheries is essential for real-time monitoring and automated control. This complete guide covers everything from sensor selection to system architecture, calibration, and troubleshooting, based on industry best practices.
1. Why DO Sensor Integration with SCADA Systems for Fisheries Matters
DO sensor integration with SCADA systems for fisheries directly addresses hypoxia risks in high-density aquaculture. Key benefits include real-time alerts for low DO, automated aeration, data logging for compliance, and remote access via web or mobile interfaces.
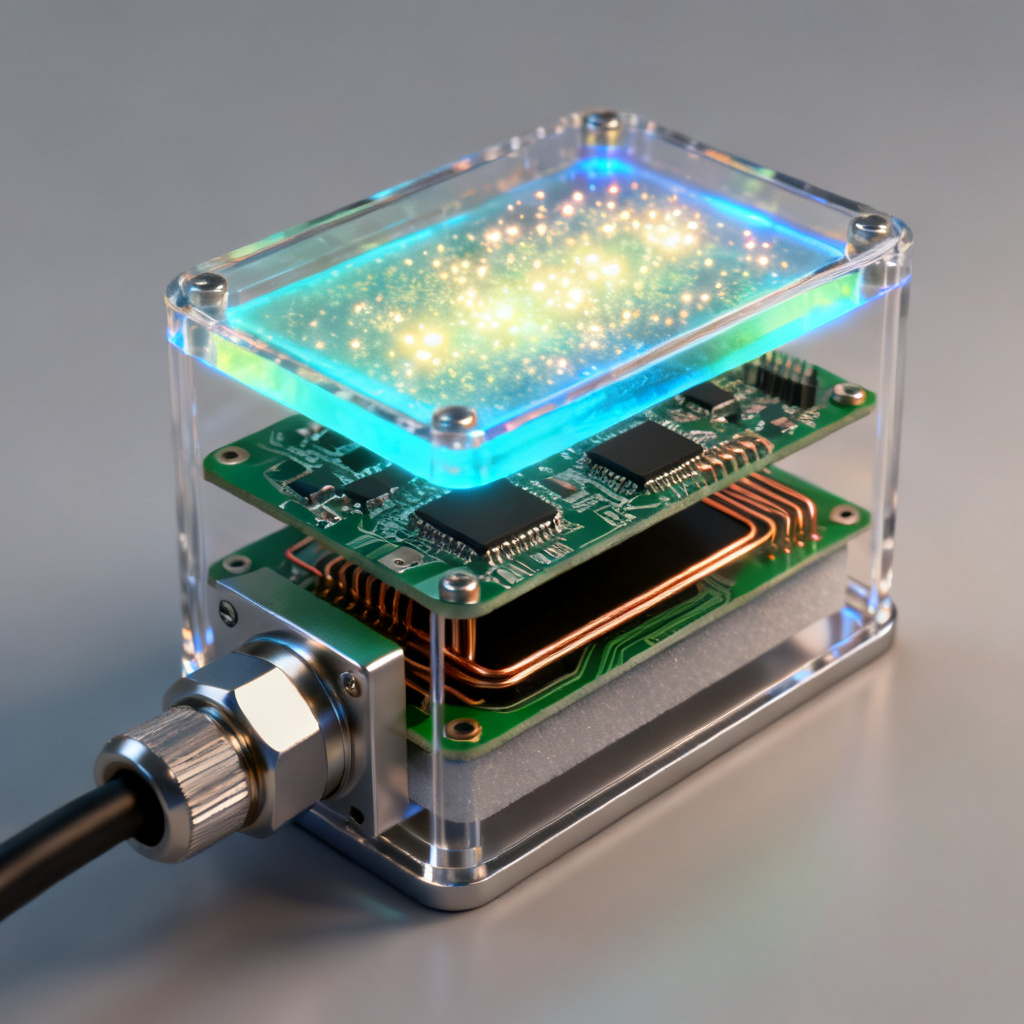
2. Types of DO Sensors for SCADA Integration
2.1 Optical (Luminescent) DO Sensors
Optical sensors use a luminescent dye quenched by oxygen, offering no electrolyte consumption and high accuracy (±0.1 mg/L). They are ideal for long-term DO sensor integration with SCADA systems for fisheries due to stable output.
2.2 Galvanic Electrochemical Sensors
Galvanic sensors generate a current proportional to oxygen, with low cost and fast response, but require periodic membrane replacement.
2.3 Polarographic (Clark-Type) Sensors
Polarographic sensors measure current from oxygen reduction, offering high sensitivity but needing warm-up time and flow sensitivity.
Integration Tip: For reliable DO sensor integration with SCADA systems for fisheries, optical sensors are preferred due to lower drift and longer calibration intervals.
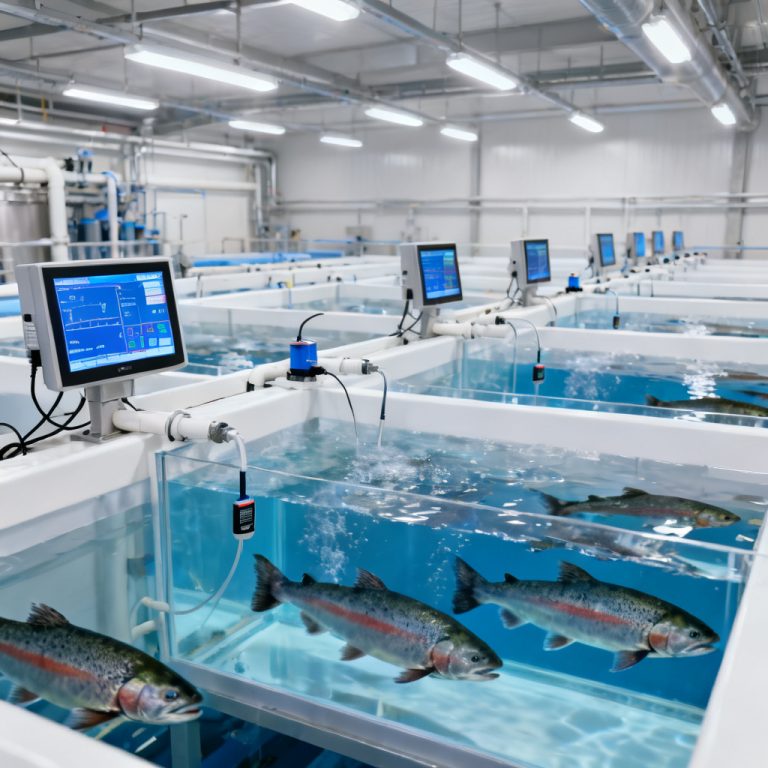
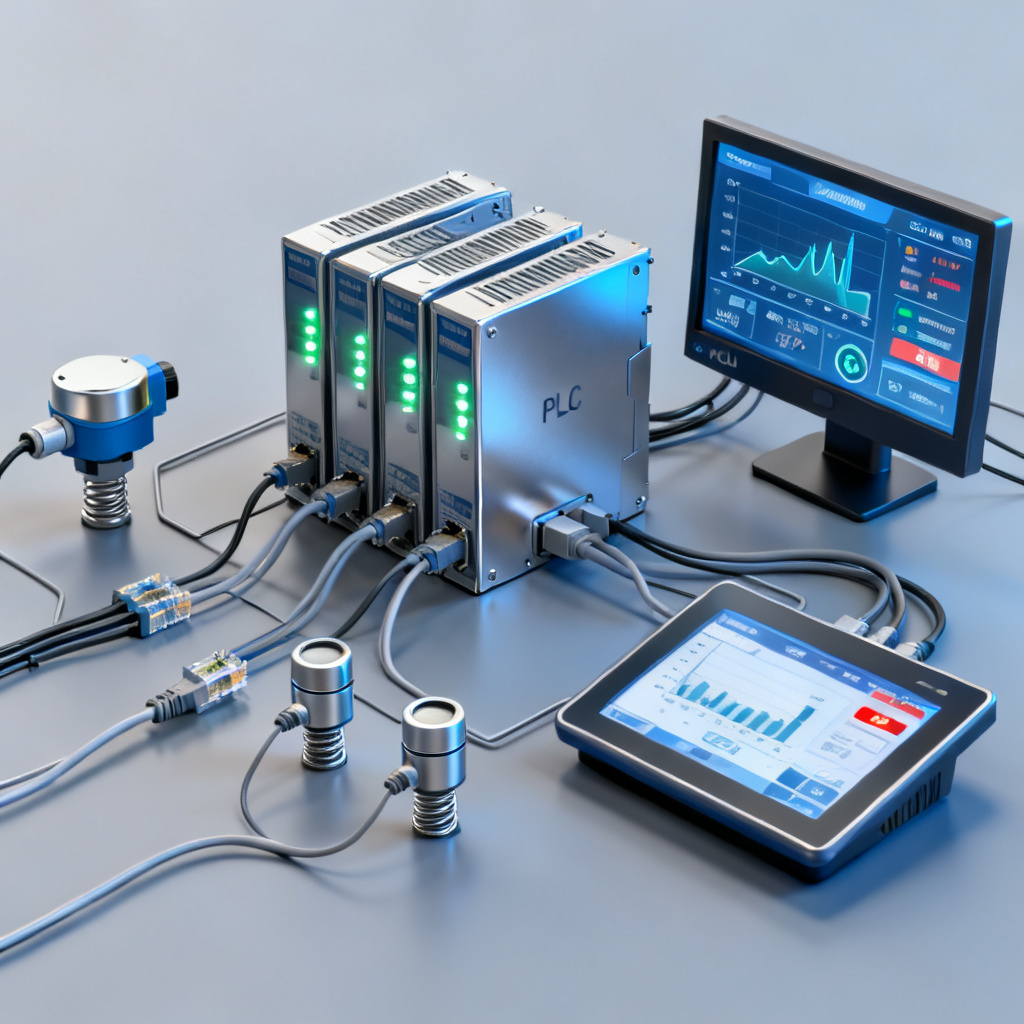
3. SCADA System Architecture for DO Monitoring
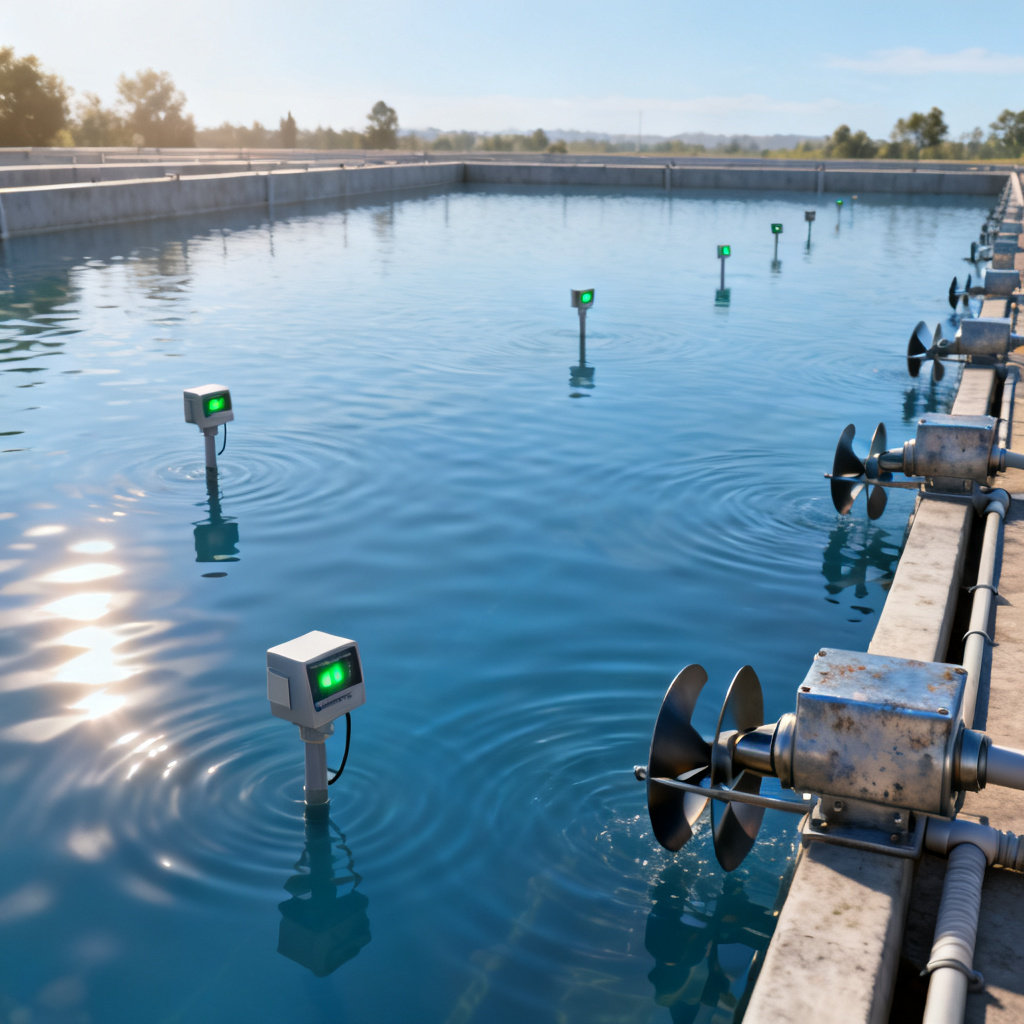
3.1 Field Level: Sensors and Actuators
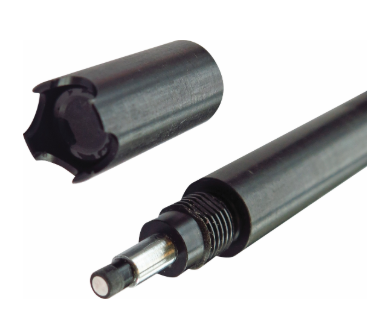
DO sensors with analog 4-20 mA or digital RS-485/Modbus RTU outputs, submersible cables with IP68 rating, and actuators like aerators.
3.2 Control Level: PLCs and RTUs
PLCs receive sensor data and execute control logic (e.g., if DO < 5 mg/L, trigger aerator).
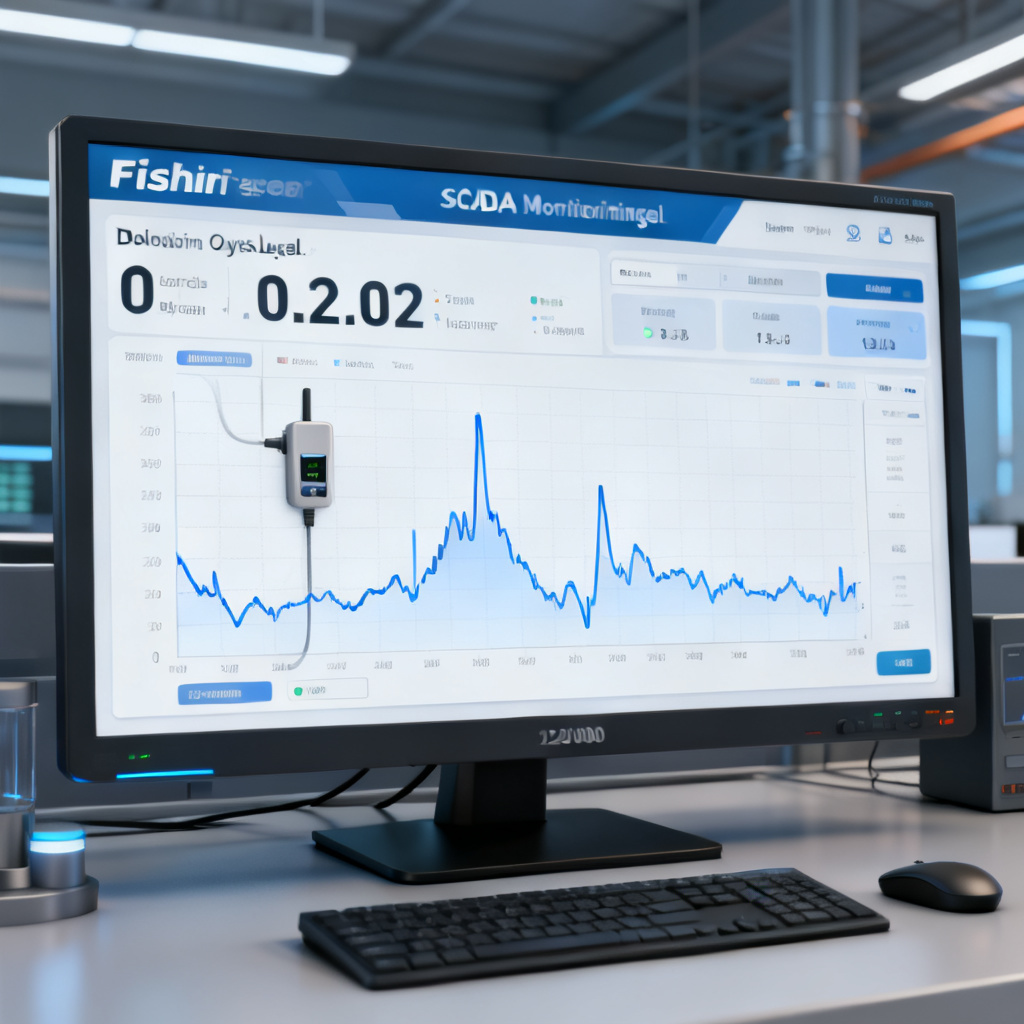
3.3 Supervisory Level: HMI and Data Server
SCADA software for data logging, alarms, and trend charts.
3.4 Communication Layer
Wired RS-485/Ethernet or wireless LoRaWAN/4G, with Modbus RTU/TCP as industry standard for DO sensor integration with SCADA systems for fisheries.
4. Step-by-Step Integration Process
Step 1: Sensor Selection and Procurement
Choose a digital Modbus output sensor with range 0–20 mg/L and IP68 rating.
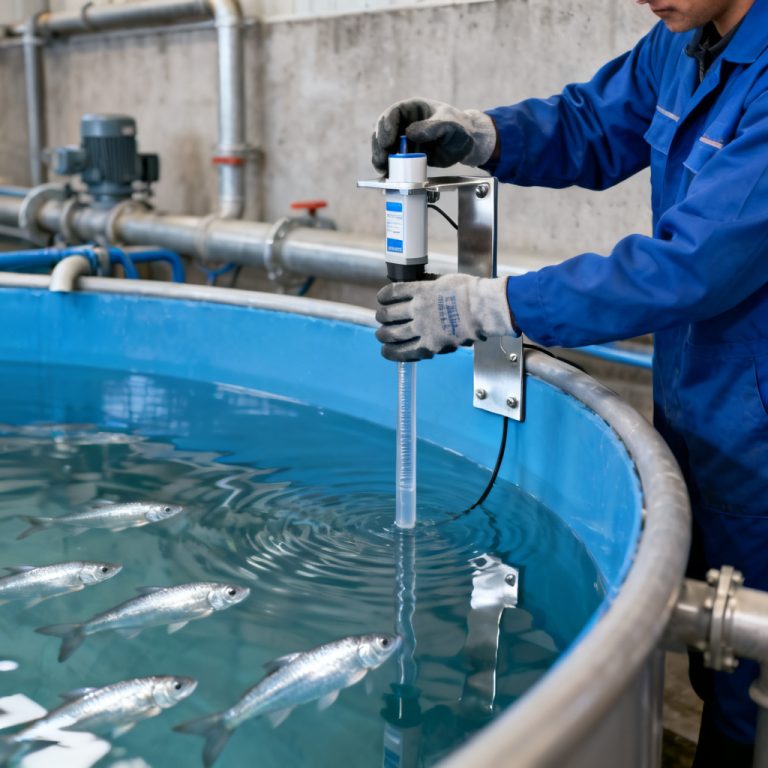
Step 2: Sensor Installation
Place sensors 1–2 feet below surface in shallow ponds or at multiple depths in deep tanks, away from stagnant areas or direct aeration bubbles.
Step 3: Wiring and Electrical Connections
For analog sensors, connect 4-20 mA to PLC analog input; for digital, use twisted-pair shielded cable for RS-485 with 120-ohm termination.
Step 4: PLC Programming
Configure analog input scaling (4 mA = 0 mg/L, 20 mA = 20 mg/L) and implement set point control or PID for precise aeration.
Step 5: SCADA Configuration
Set up Modbus TCP/IP mapping, create HMI screens with real-time DO values and trend graphs, and configure data logging intervals.
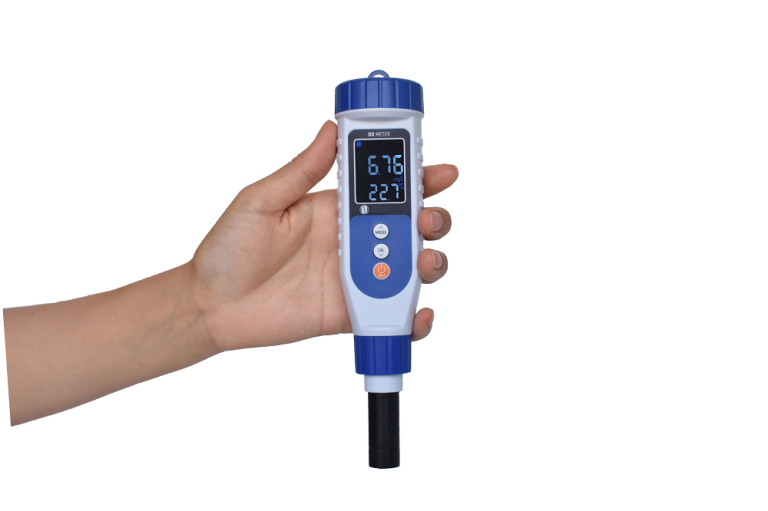
Step 6: Calibration and Validation
Perform two-point calibration (zero and span points) and document results in SCADA logs; validate quarterly with a handheld meter.
5. Calibration Best Practices for Long-Term Accuracy
Proper calibration ensures reliable data for DO sensor integration with SCADA systems for fisheries. Calibrate optical sensors every 3–6 months, electrochemical sensors monthly. Use a calibration chamber or wet towel method; ensure temperature compensation is active.
6. Troubleshooting Common Integration Issues
| Issue | Possible Cause | Solution |
|---|---|---|
| DO readings stuck at 0 mg/L | Sensor disconnected or power failure | Check wiring and power supply |
| Erratic readings | Air bubbles or biofouling | Clean sensor; reposition away from aerators |
| Communication loss | Incorrect Modbus address or baud rate | Verify settings; check termination resistors |
| Drift over time | Biofouling or electrolyte depletion | Clean and recalibrate; replace membrane |
| No response to aeration | PLC logic error or relay failure | Review PLC code; test relay manually |
7. Advanced Features for Fisheries Optimization
Modern SCADA systems enhance DO sensor integration with SCADA systems for fisheries through predictive analytics for hypoxic events, multi-zone control for individual ponds, energy optimization with VFDs (up to 30% reduction), and cloud integration for remote monitoring.
8. Maintenance Schedule for DO Sensors in Fisheries
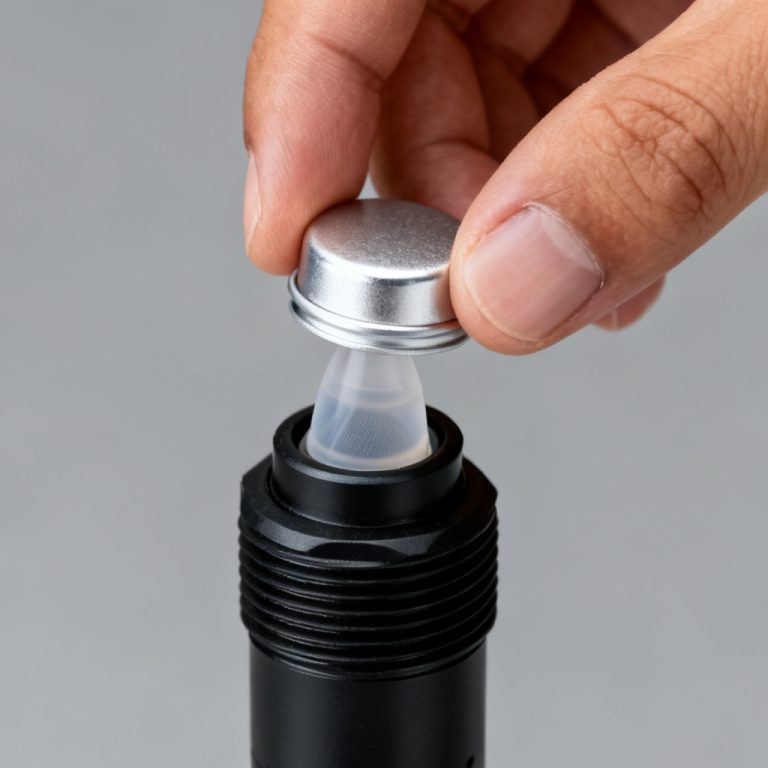
Weekly: visual inspection and cleaning. Monthly: check cable connectors and verify calibration. Quarterly: full calibration and inspect O-rings. Annually: replace sensor cap or membrane and update SCADA firmware.
9. Cost Considerations and ROI
Optical sensors ($800–$2,000), PLC/RTU ($500–$2,000), SCADA software ($1,000–$10,000). ROI includes reduced fish mortality (up to 20% savings), lower energy costs (15–30% reduction), and improved yield (5–10% increase).
10. Future Trends in DO Monitoring for Fisheries
IoT-enabled sensors with LoRaWAN, AI-driven control, biocompatible anti-fouling materials, and multi-parameter probes for holistic water quality management.
Frequently Asked Questions
What is the best sensor for DO sensor integration with SCADA systems for fisheries?
Optical (luminescent) sensors are best due to low drift and minimal maintenance, making them ideal for long-term SCADA integration.
How often should DO sensors be calibrated for SCADA systems?
Optical sensors every 3–6 months; electrochemical sensors monthly, to ensure accuracy in DO sensor integration with SCADA systems for fisheries.
Can I use wireless communication for DO sensor integration with SCADA systems for fisheries?
Yes, LoRaWAN or 4G/5G are suitable for remote ponds, though wired RS-485 offers higher reliability.
What is the typical ROI for DO sensor integration with SCADA systems for fisheries?
ROI includes up to 20% reduction in fish mortality and 30% energy savings, typically achieved within 1–2 years.